Clients
This section contains a list of your clients with detailed information about them. Also in this section you can view detailed statistics of the client, as well as manage the balance of his account.
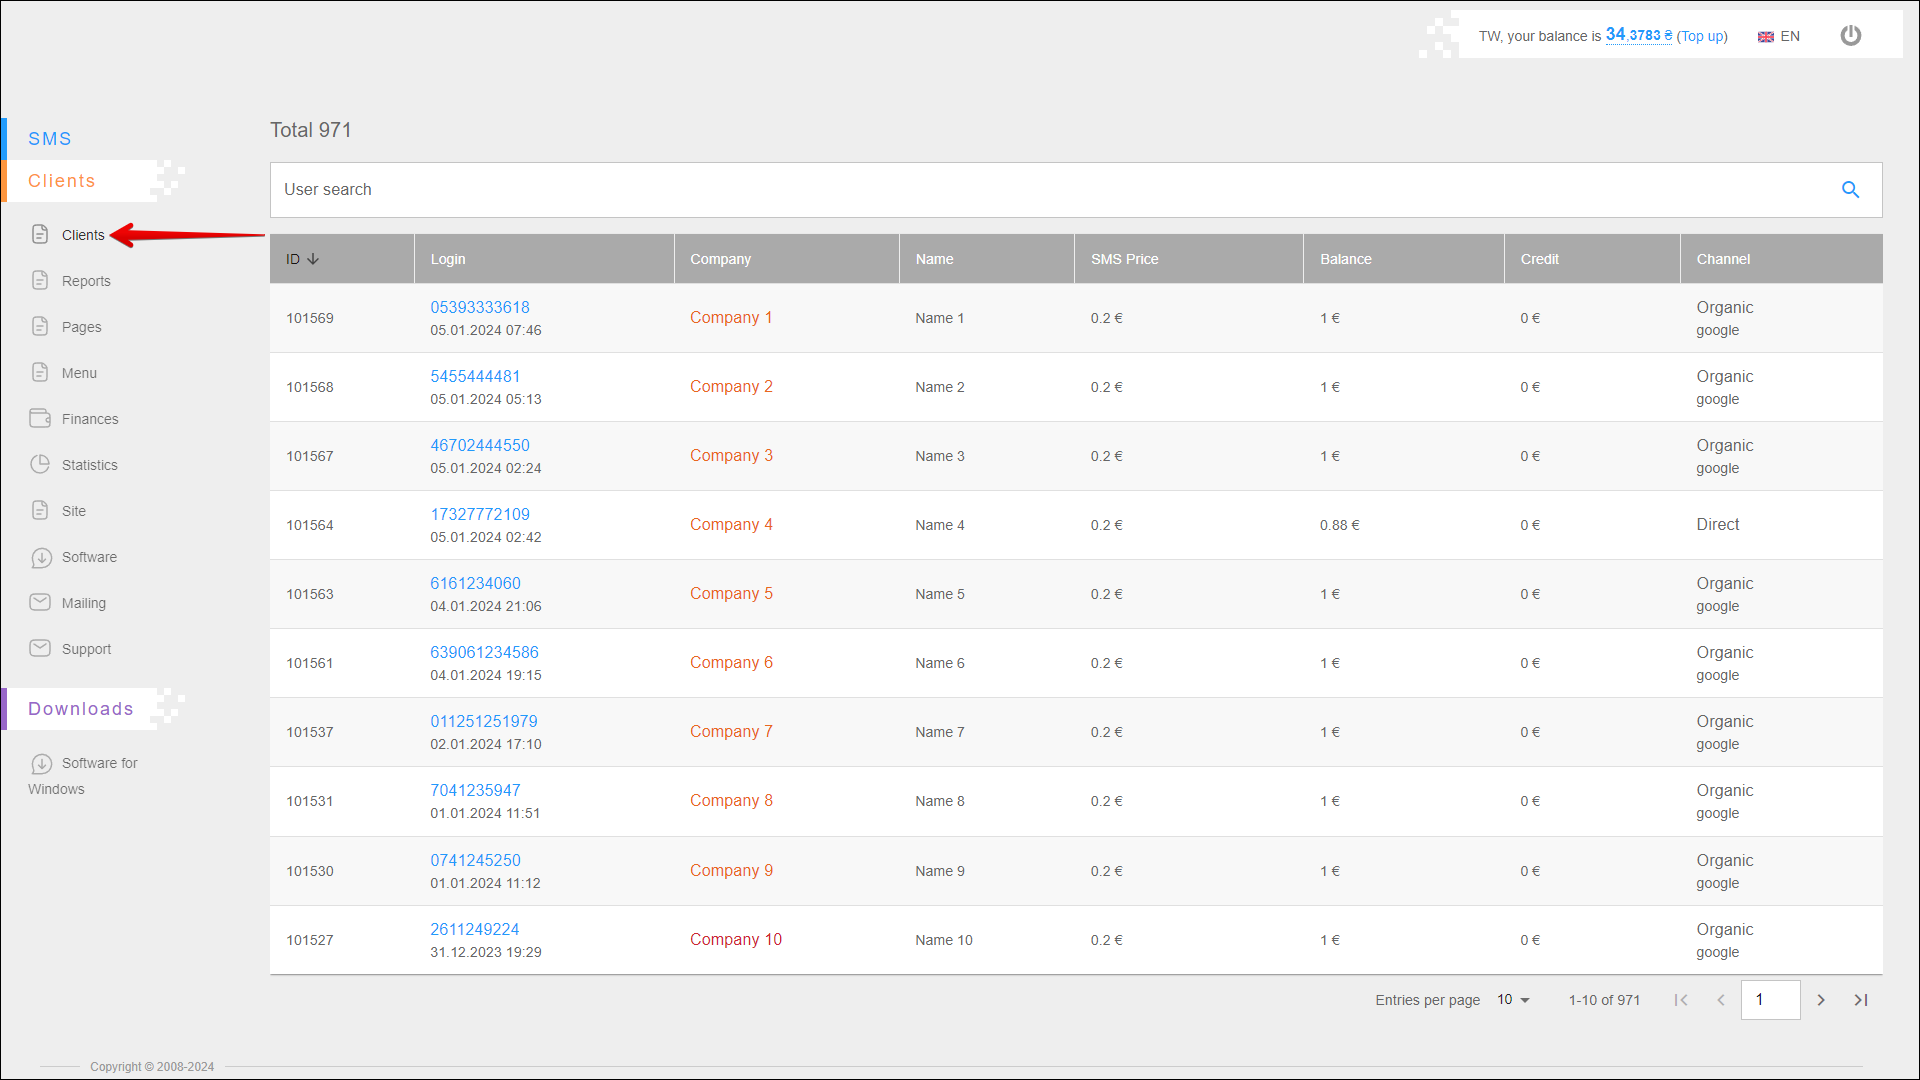
To open this section, select Clients → Clients in the side menu.
Interface
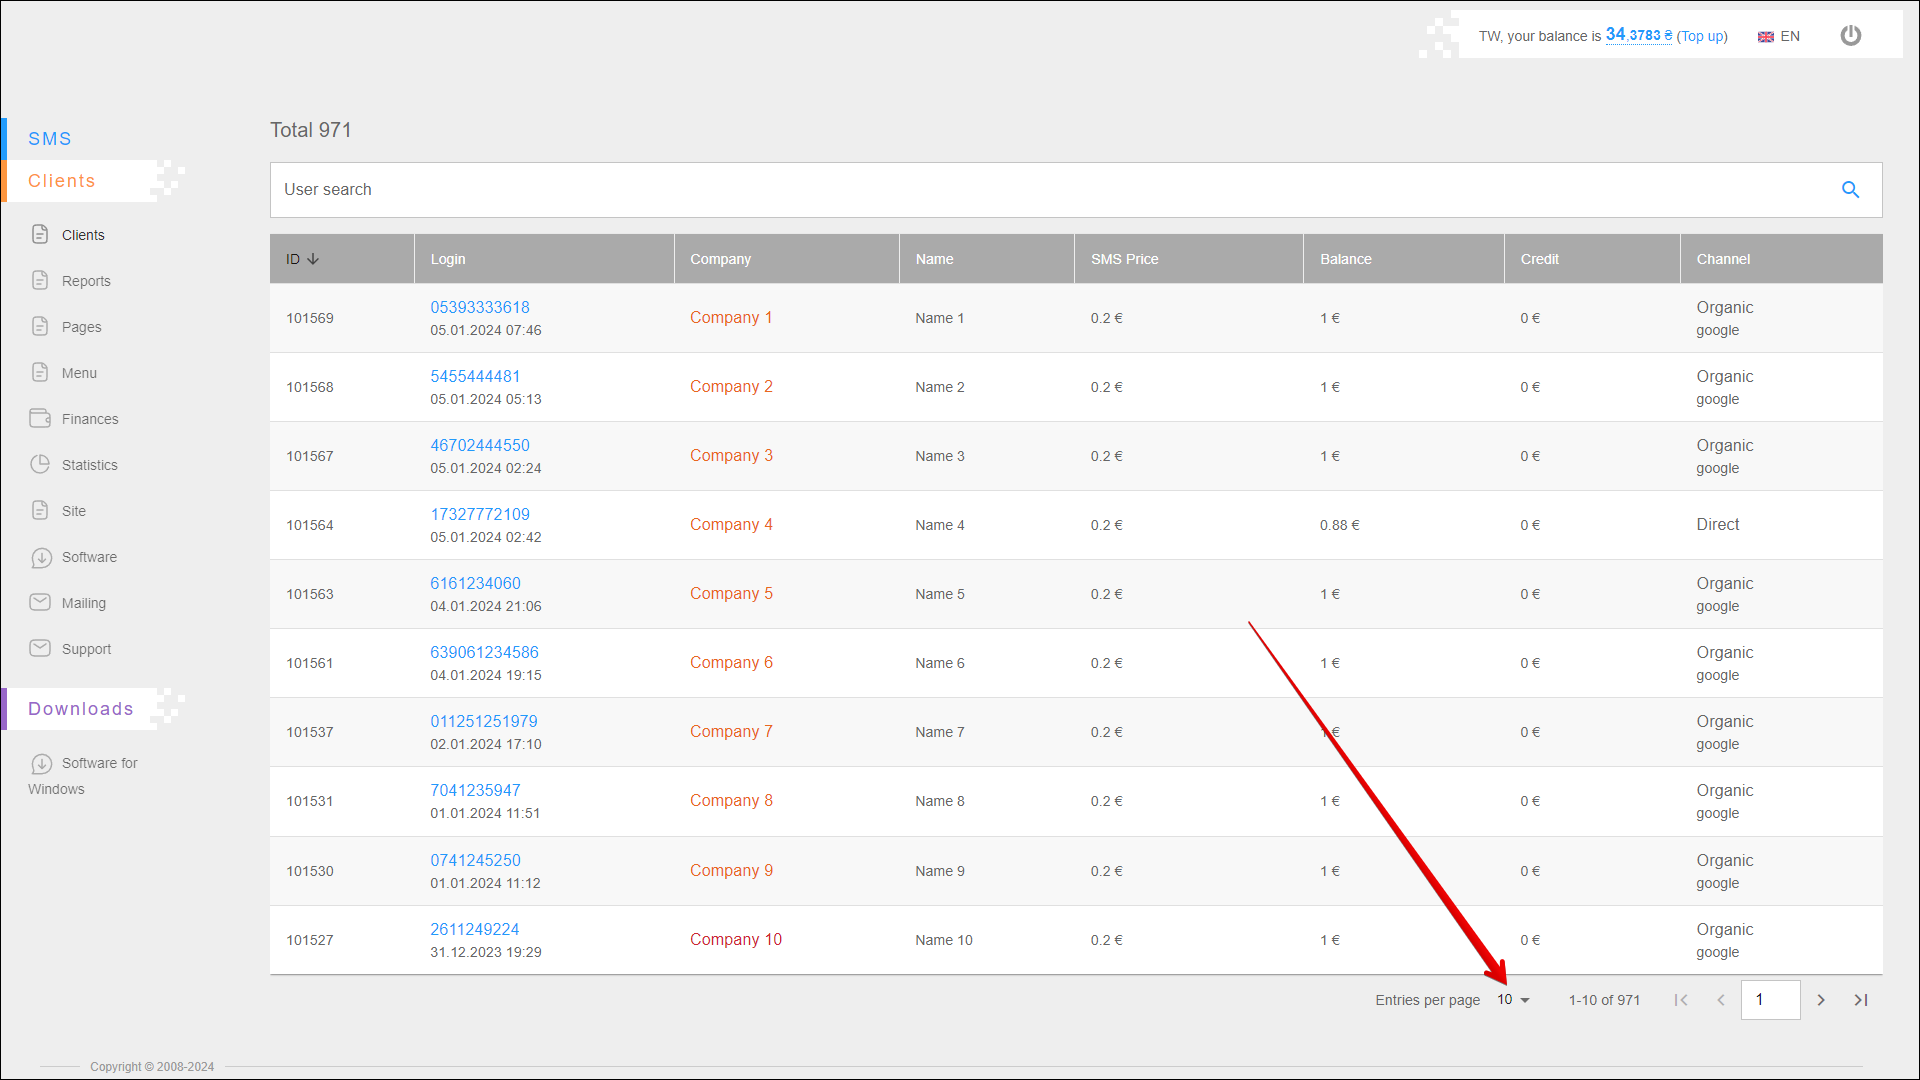
For the convenience of working with the contents of the table, it is possible to select the number of records to be displayed on the page. You can choose 10 or 20 rows.
To change the number of entries displayed on the client list page, click the number of pages icon at the bottom of the page.
By default, up to 10 entries are displayed per page.
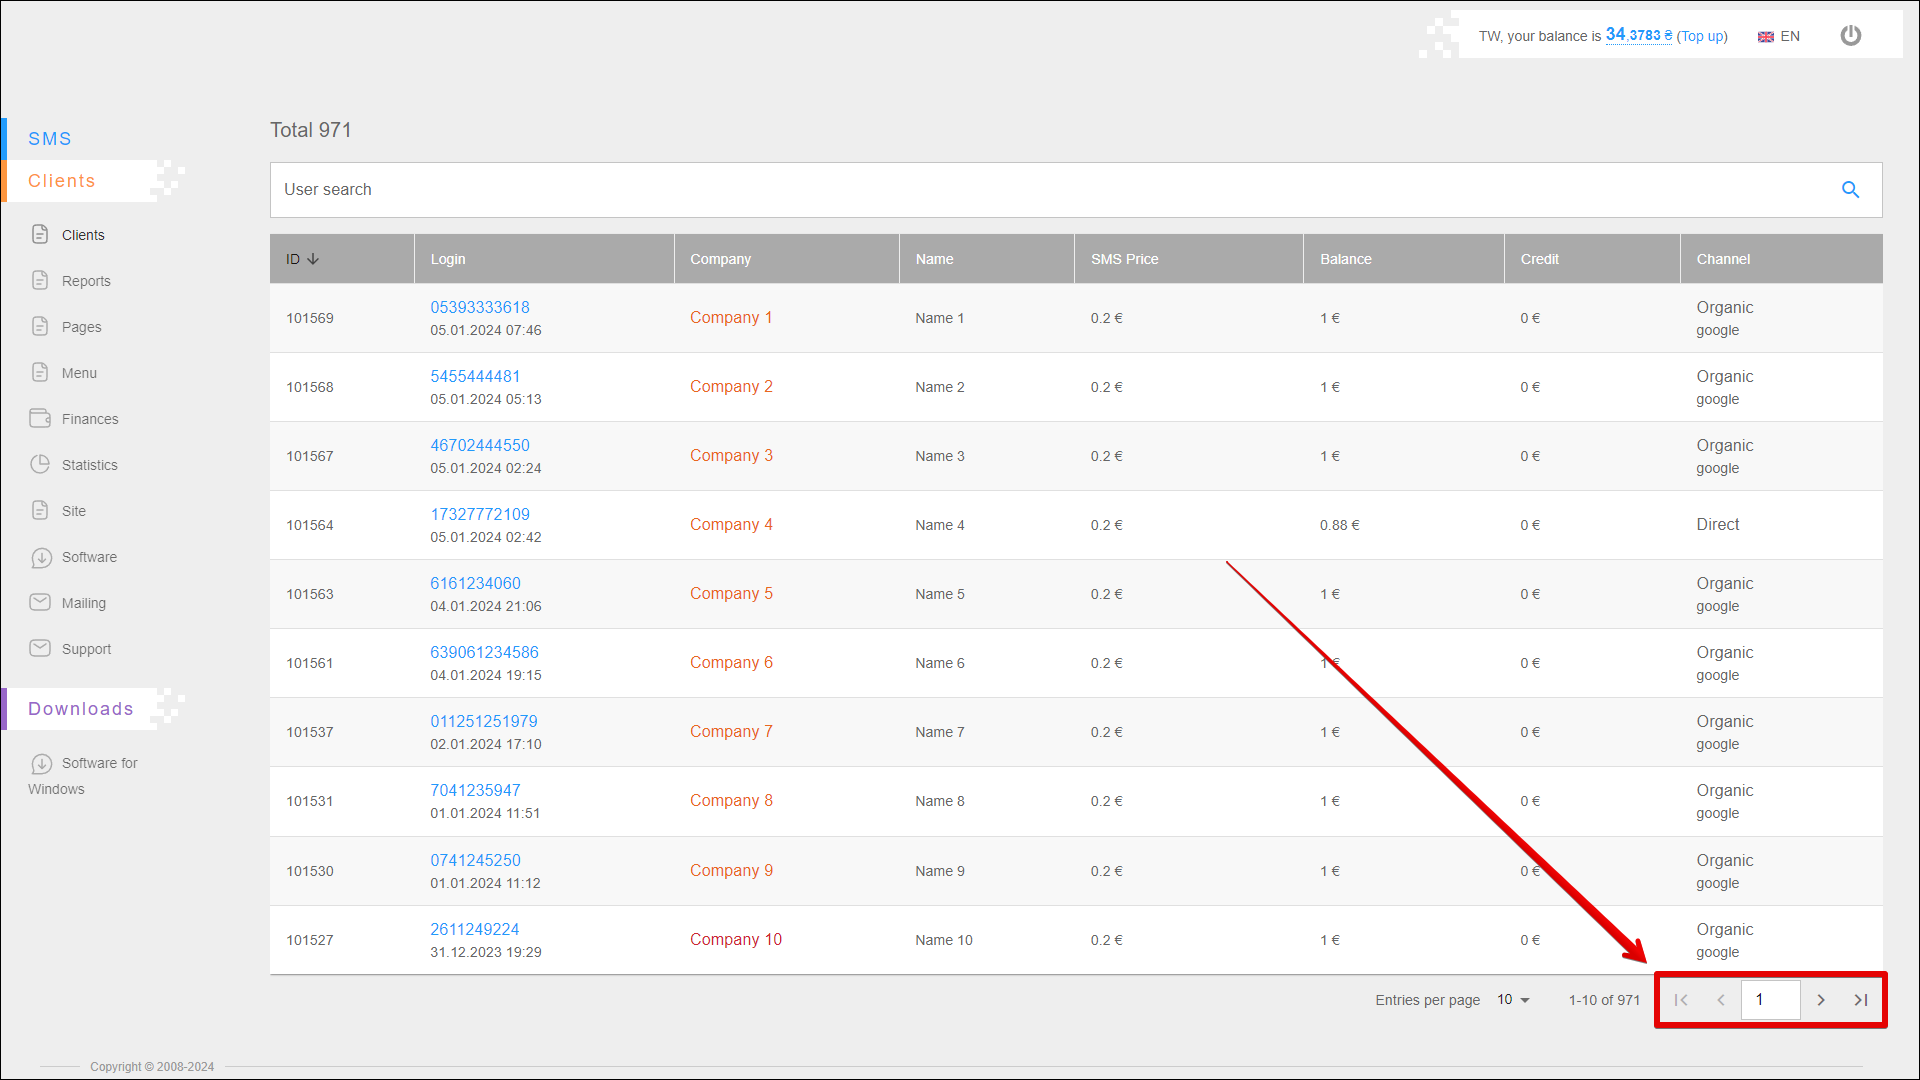
Use the Left and Right navigation buttons at the bottom of the page to switch pages. You can also enter the number of the desired page to jump to it.
Search
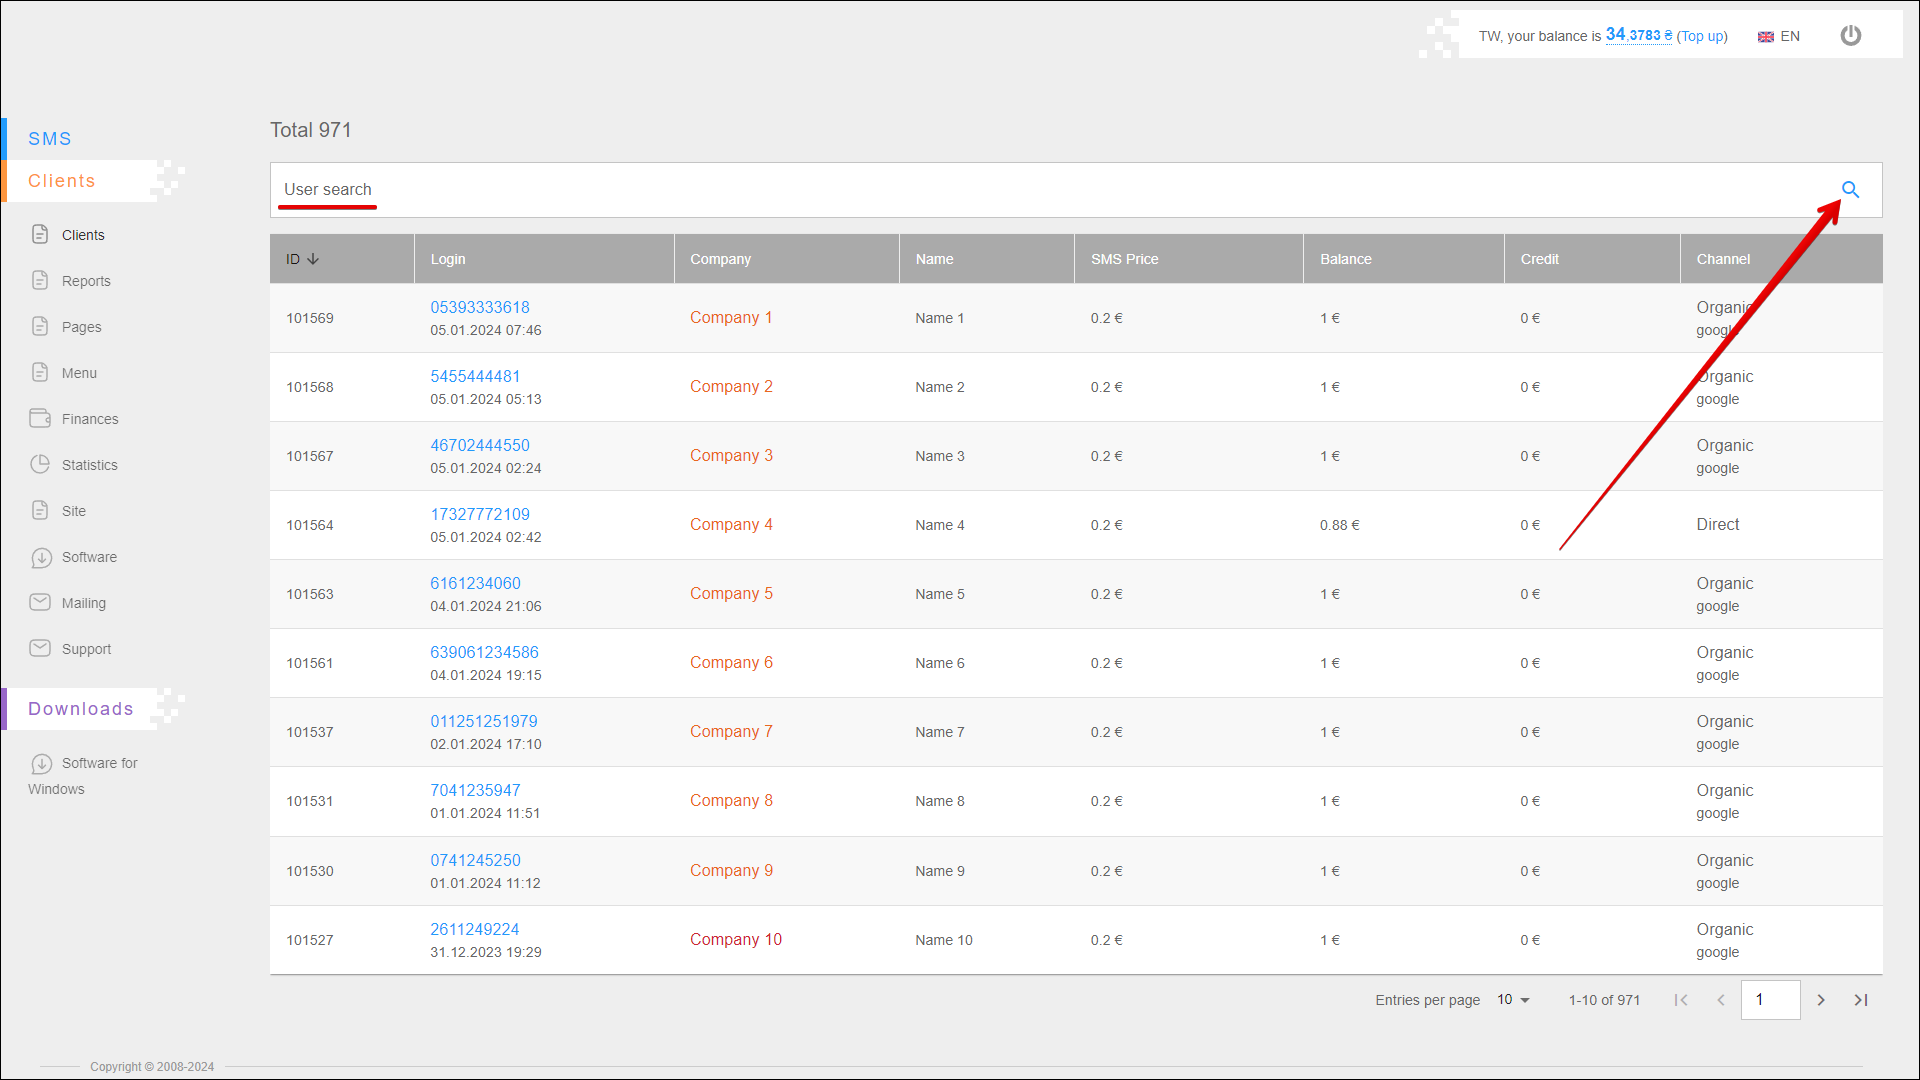
To search for a specific client, enter the desired value in the User search field and press the Search button icon or [ Enter ] key. You can search for a client by ID, login, company name or client name.
Client table
The table contains a list of clients with detailed information about them. The data is arranged in separate columns.
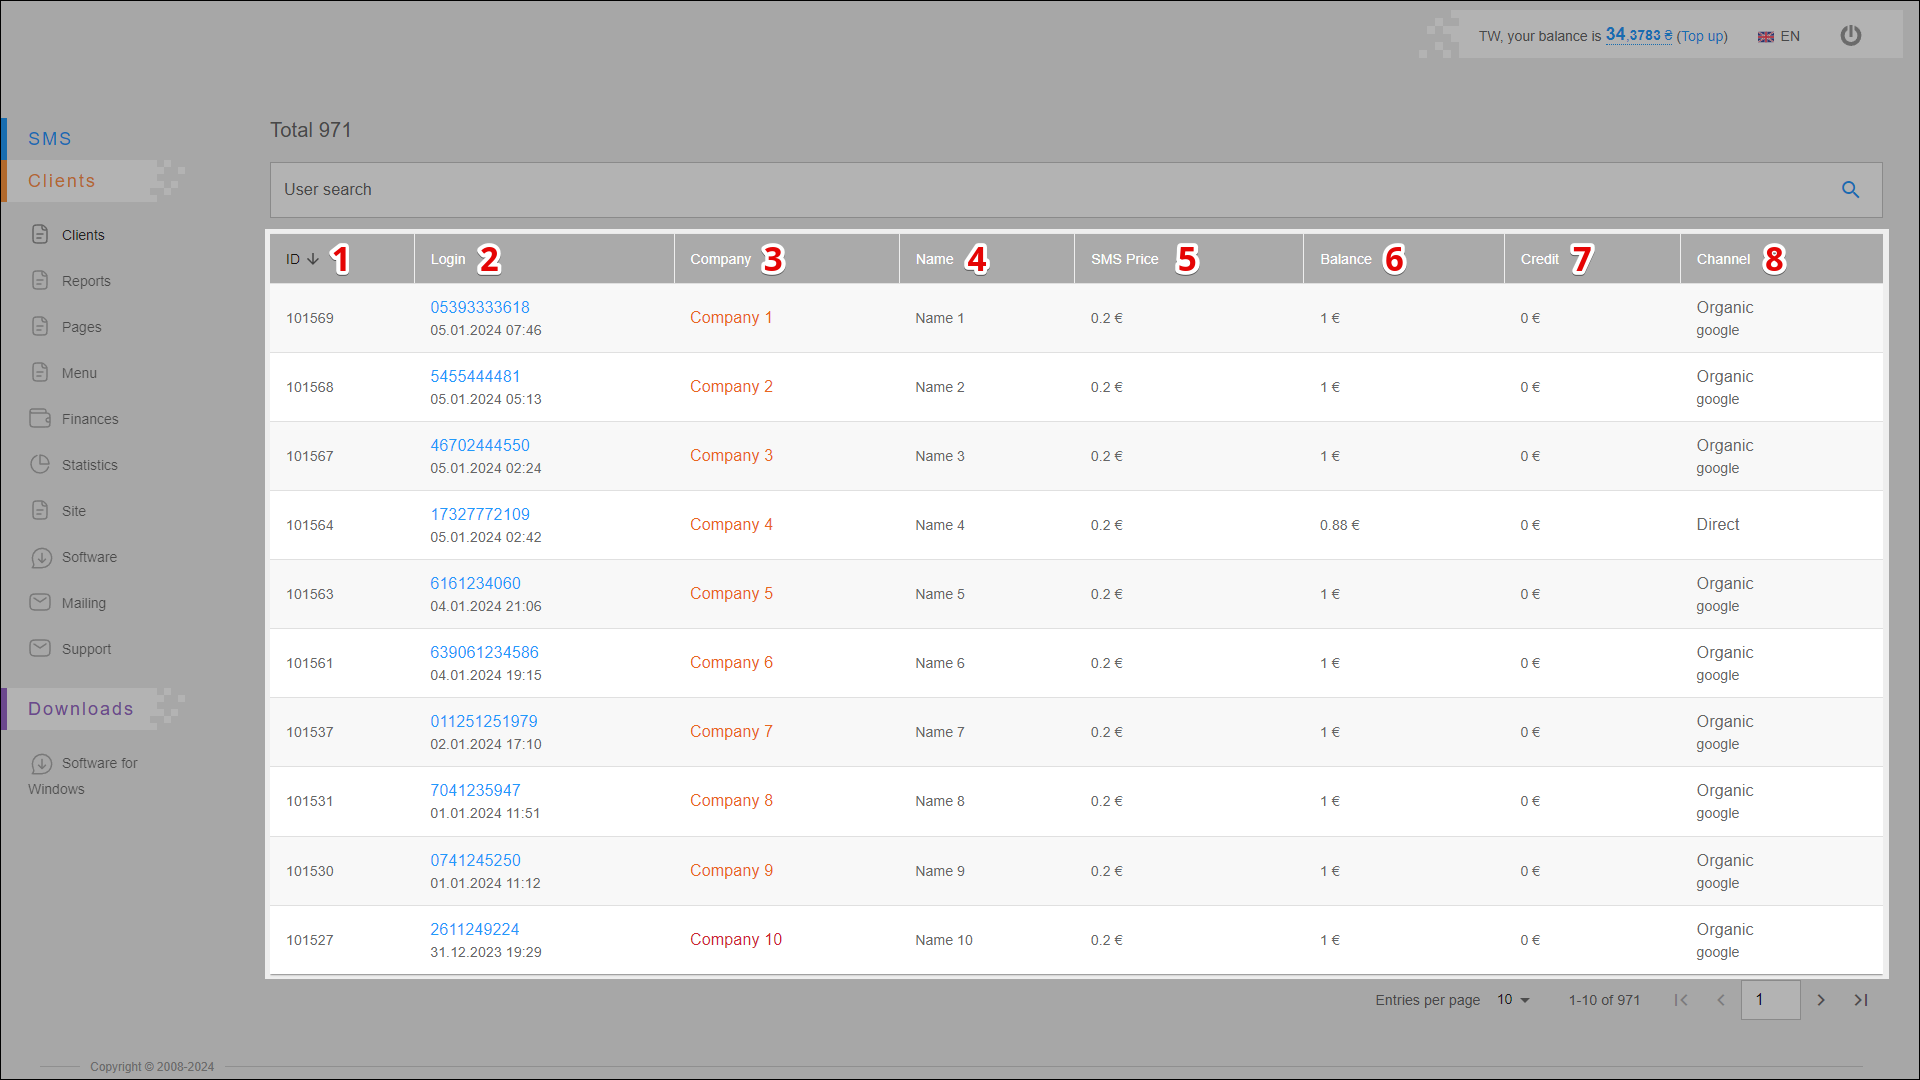
| № | Column | Description |
|---|---|---|
| 1 | ID | Internal unique identifier of the client You can sort the list of clients by ID, to do this, click the relevant icon in the ID column: |
| 2 | Login | Client login (phone number) |
| 3 | Company | Client's company name |
| 4 | Name | Client name |
| 5 | SMS Price | Cost of sending a message for a client |
| 6 | Balance | Current balance of the client's account |
| 7 | Credit | Credit balance of the customer's account |
| 8 | Channel |
Client page
To view the client page, in the table, click on the row of the desired client.
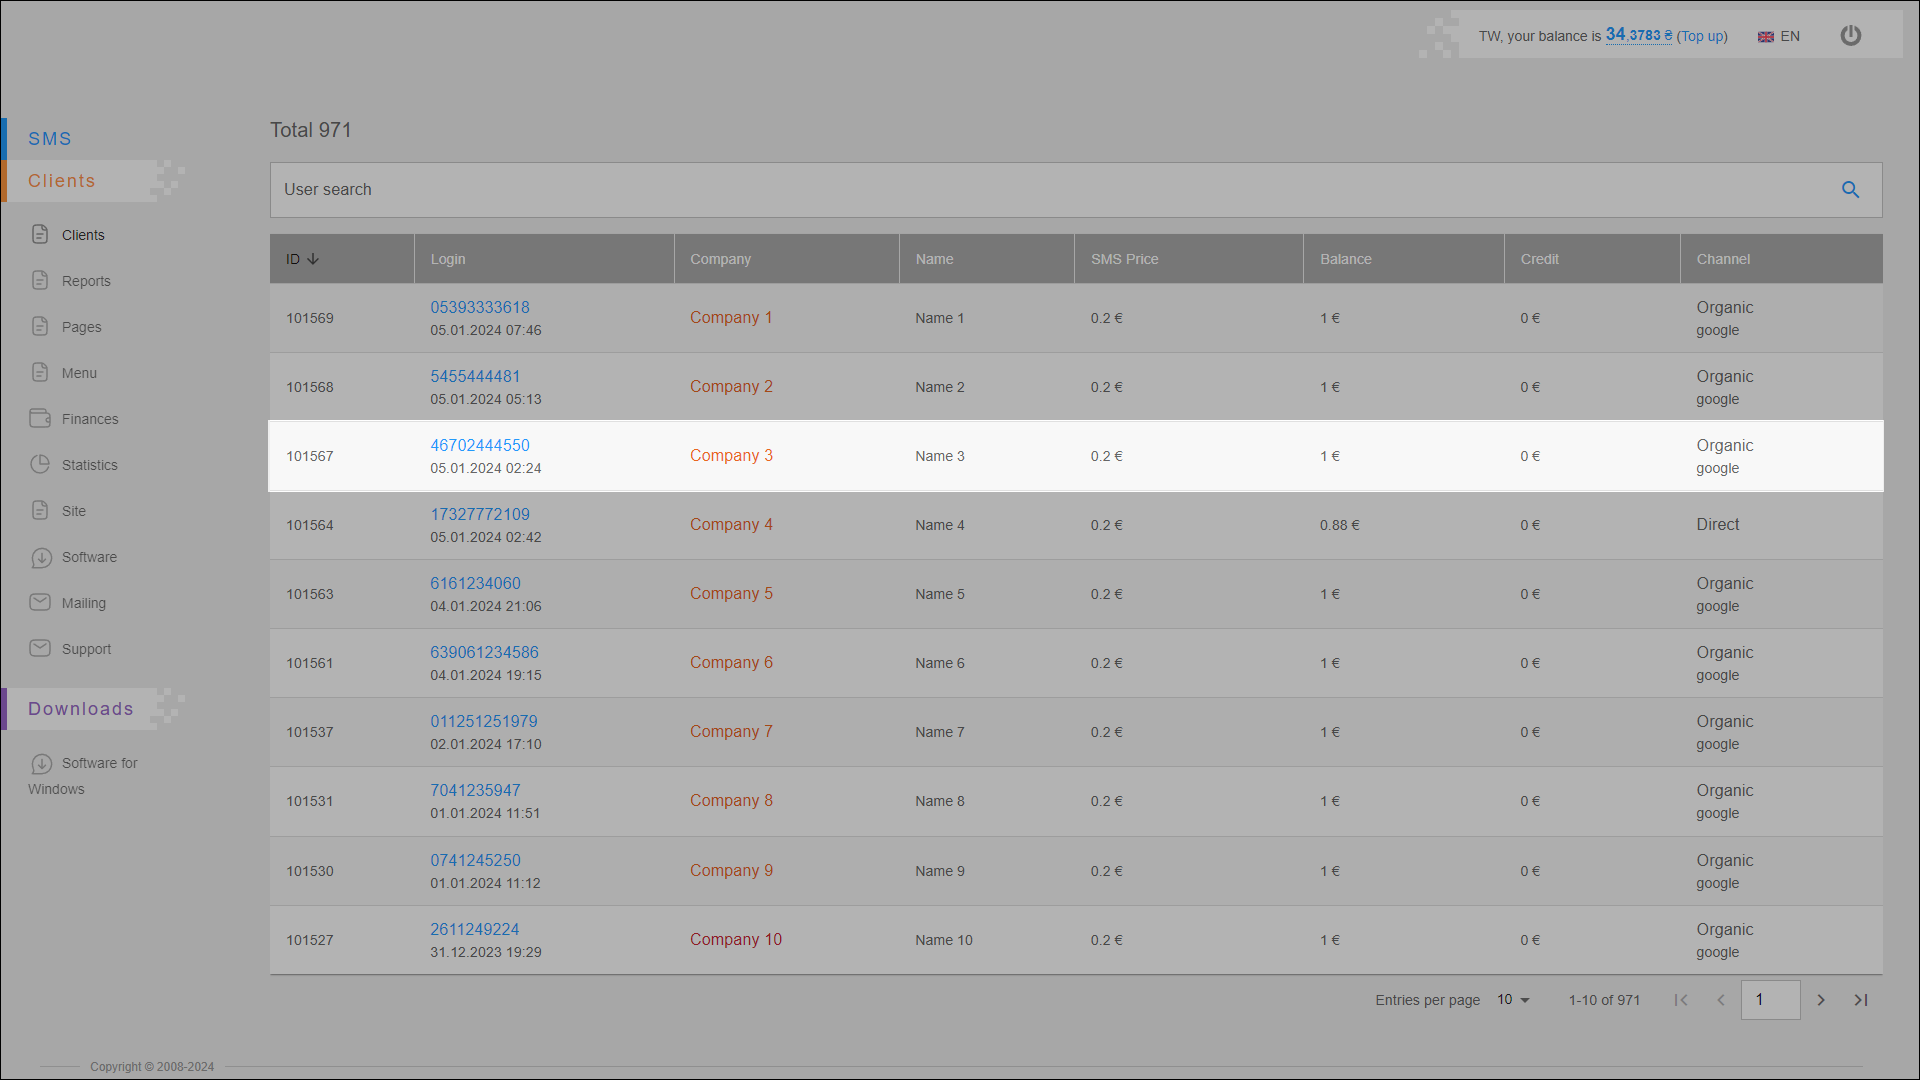
The client page contains the following tabs:
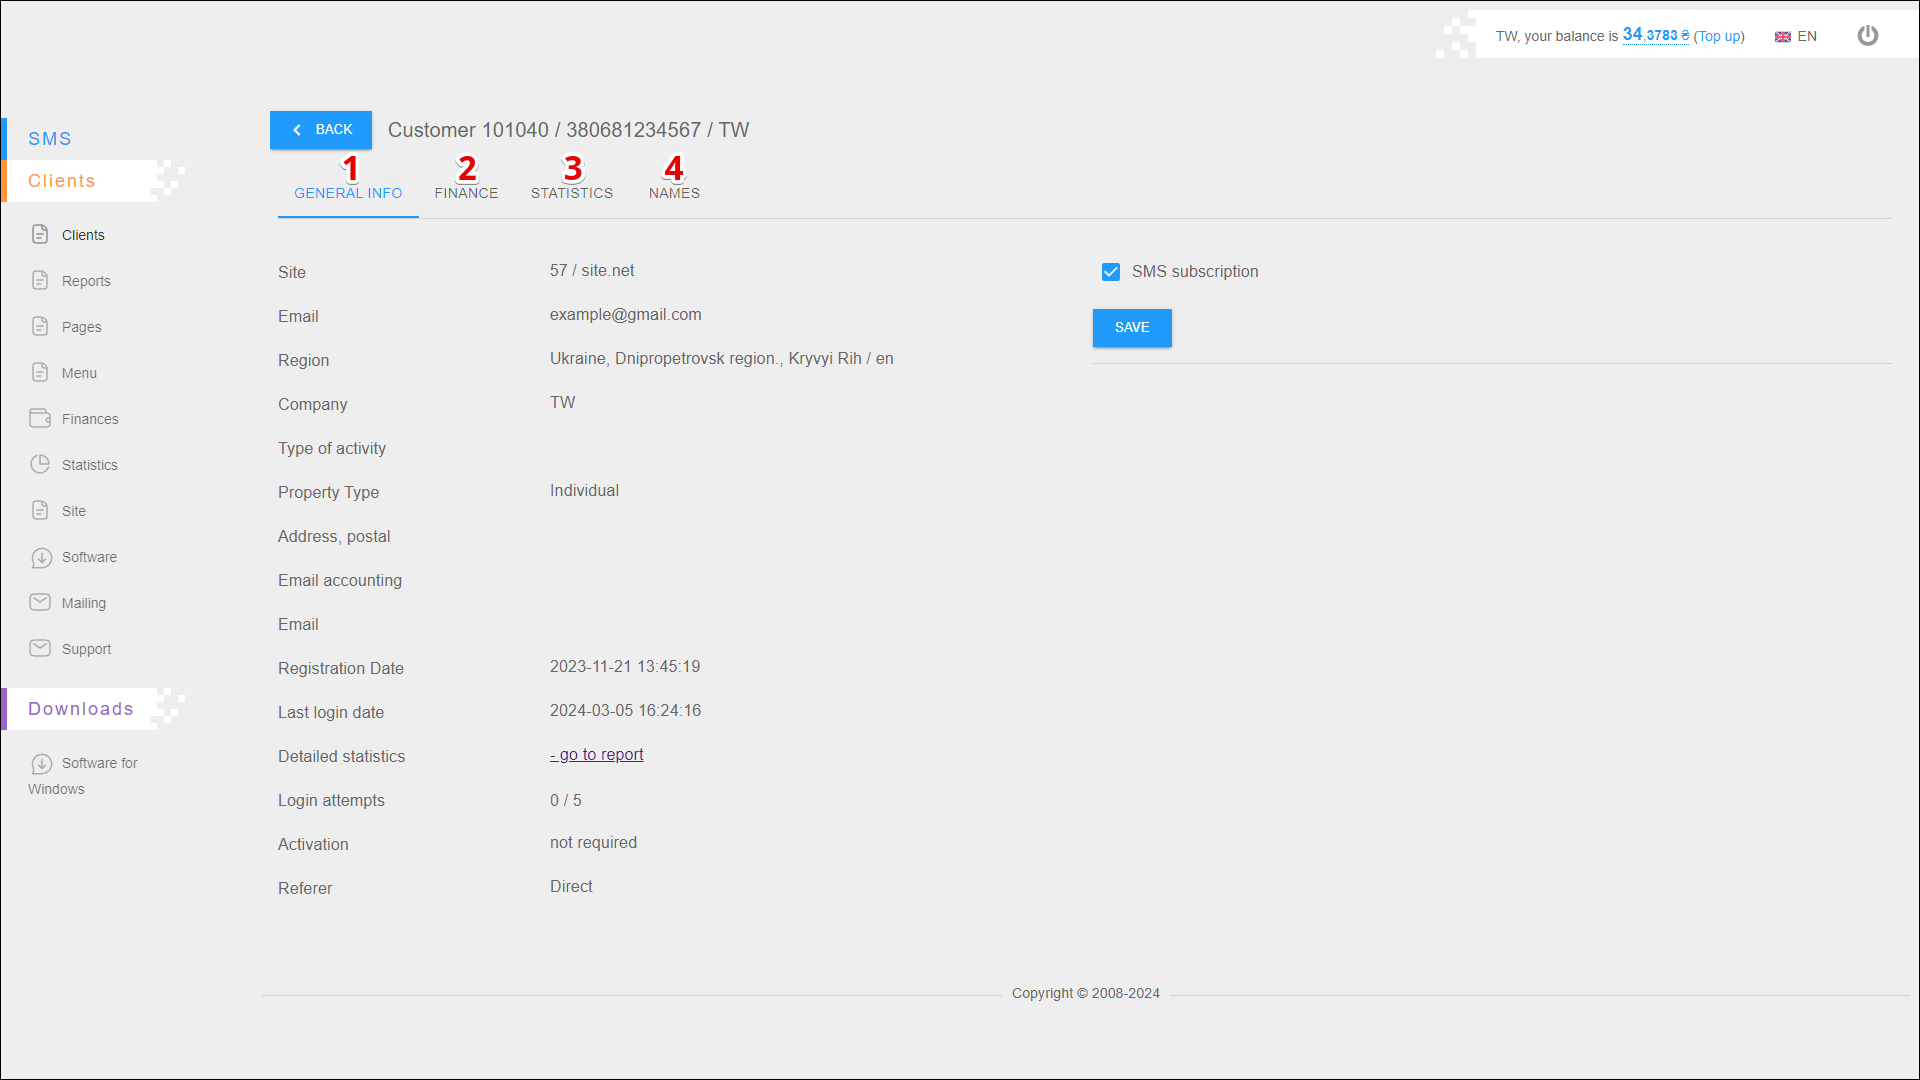
| № | Tab | Description |
|---|---|---|
| 1 | GENERAL INFO | Contains basic customer information and also allows you to manage SMS subscription |
| 2 | FINANCE | Allows you to view the client's balance change history, top up the account balance and set a credit balance |
| 3 | STATISTICS | Allows you to view detailed mailing statistics |
| 4 | NAMES | Allows you to view and edit the Sender ID of the client |
GENERAL INFO
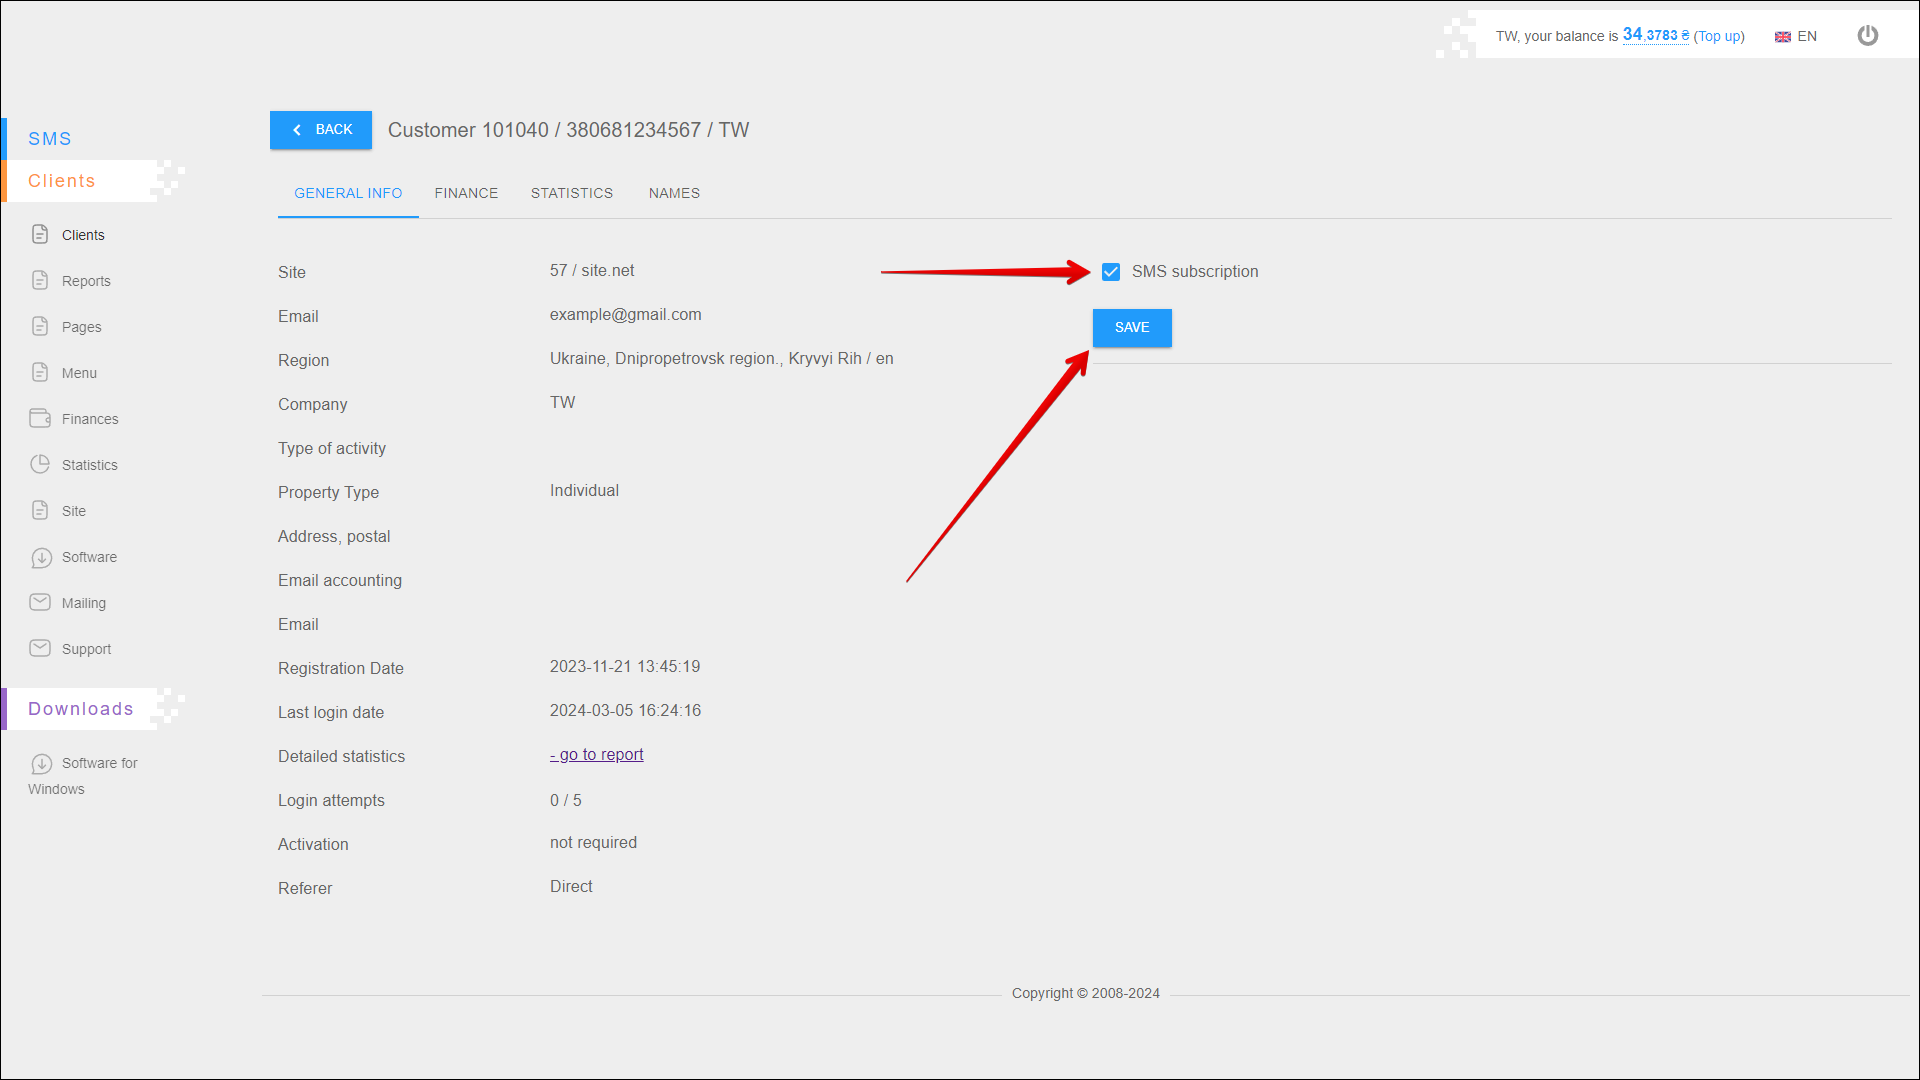
The GENERAL INFO tab contains the following information about the client:
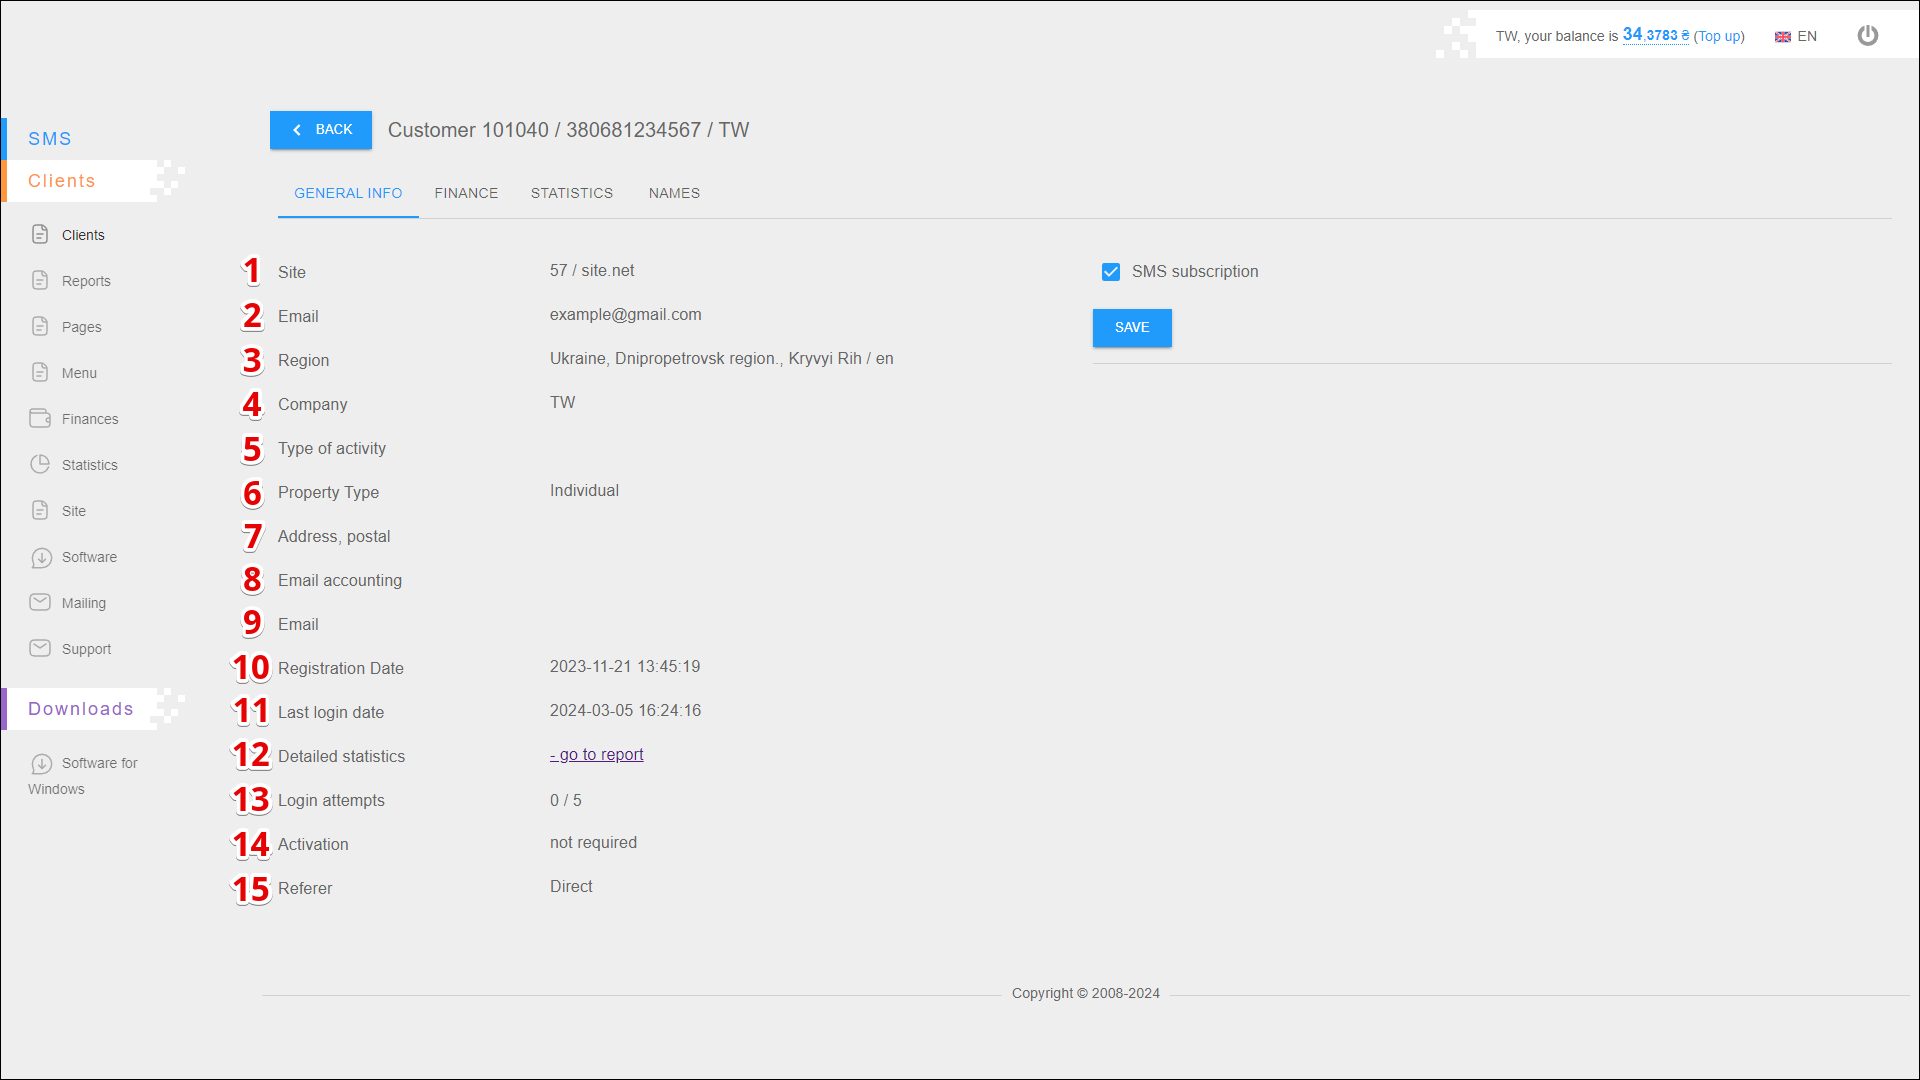
| № | Data | Description |
|---|---|---|
| 1 | Site | Client's company website |
| 2 | Client's e-mail address | |
| 3 | Region | Client's region of residence |
| 4 | Company | Client's company name |
| 5 | Type of activity | Type of activity of the client's company |
| 6 | Property Type | |
| 7 | Address, postal | Client's postal address |
| 8 | Email accounting | The e-mail address of the client company's accounting department |
| 9 | ||
| 10 | Registration Date | Date and time of client registration |
| 11 | Last login date | Date and time of the last client login |
| 12 | Detailed statistics | Link to the client's detailed statistical report |
| 13 | Login attempts | Number of unsuccessful attempts to log in to the cabinet |
| 14 | Activation | Is activation of the client's account required |
| 15 | Referer |
To enable/disable the client's SMS subscription, check the SMS subscription checkbox (or uncheck it). Then press SAVE.
FINANCE
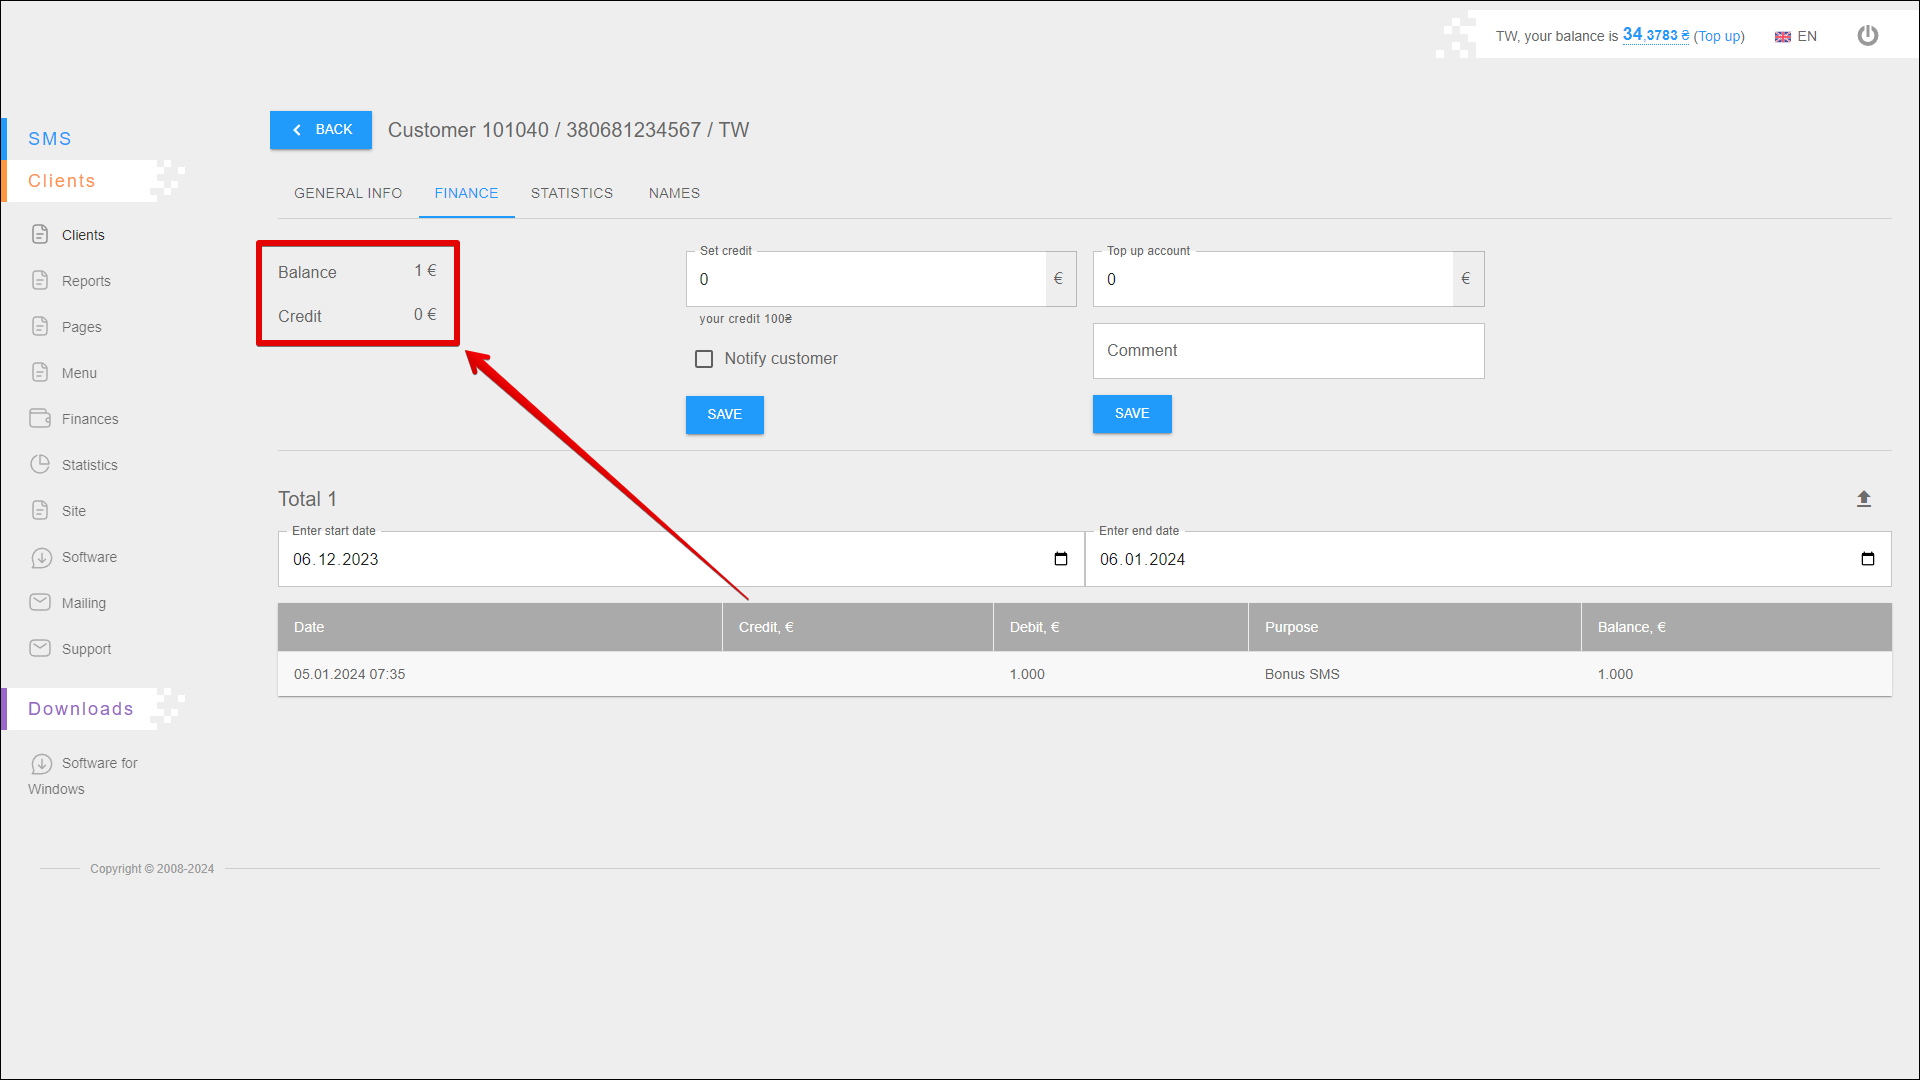
The top left of the FINANCE tab shows the current account balance and credit balance.
Set credit
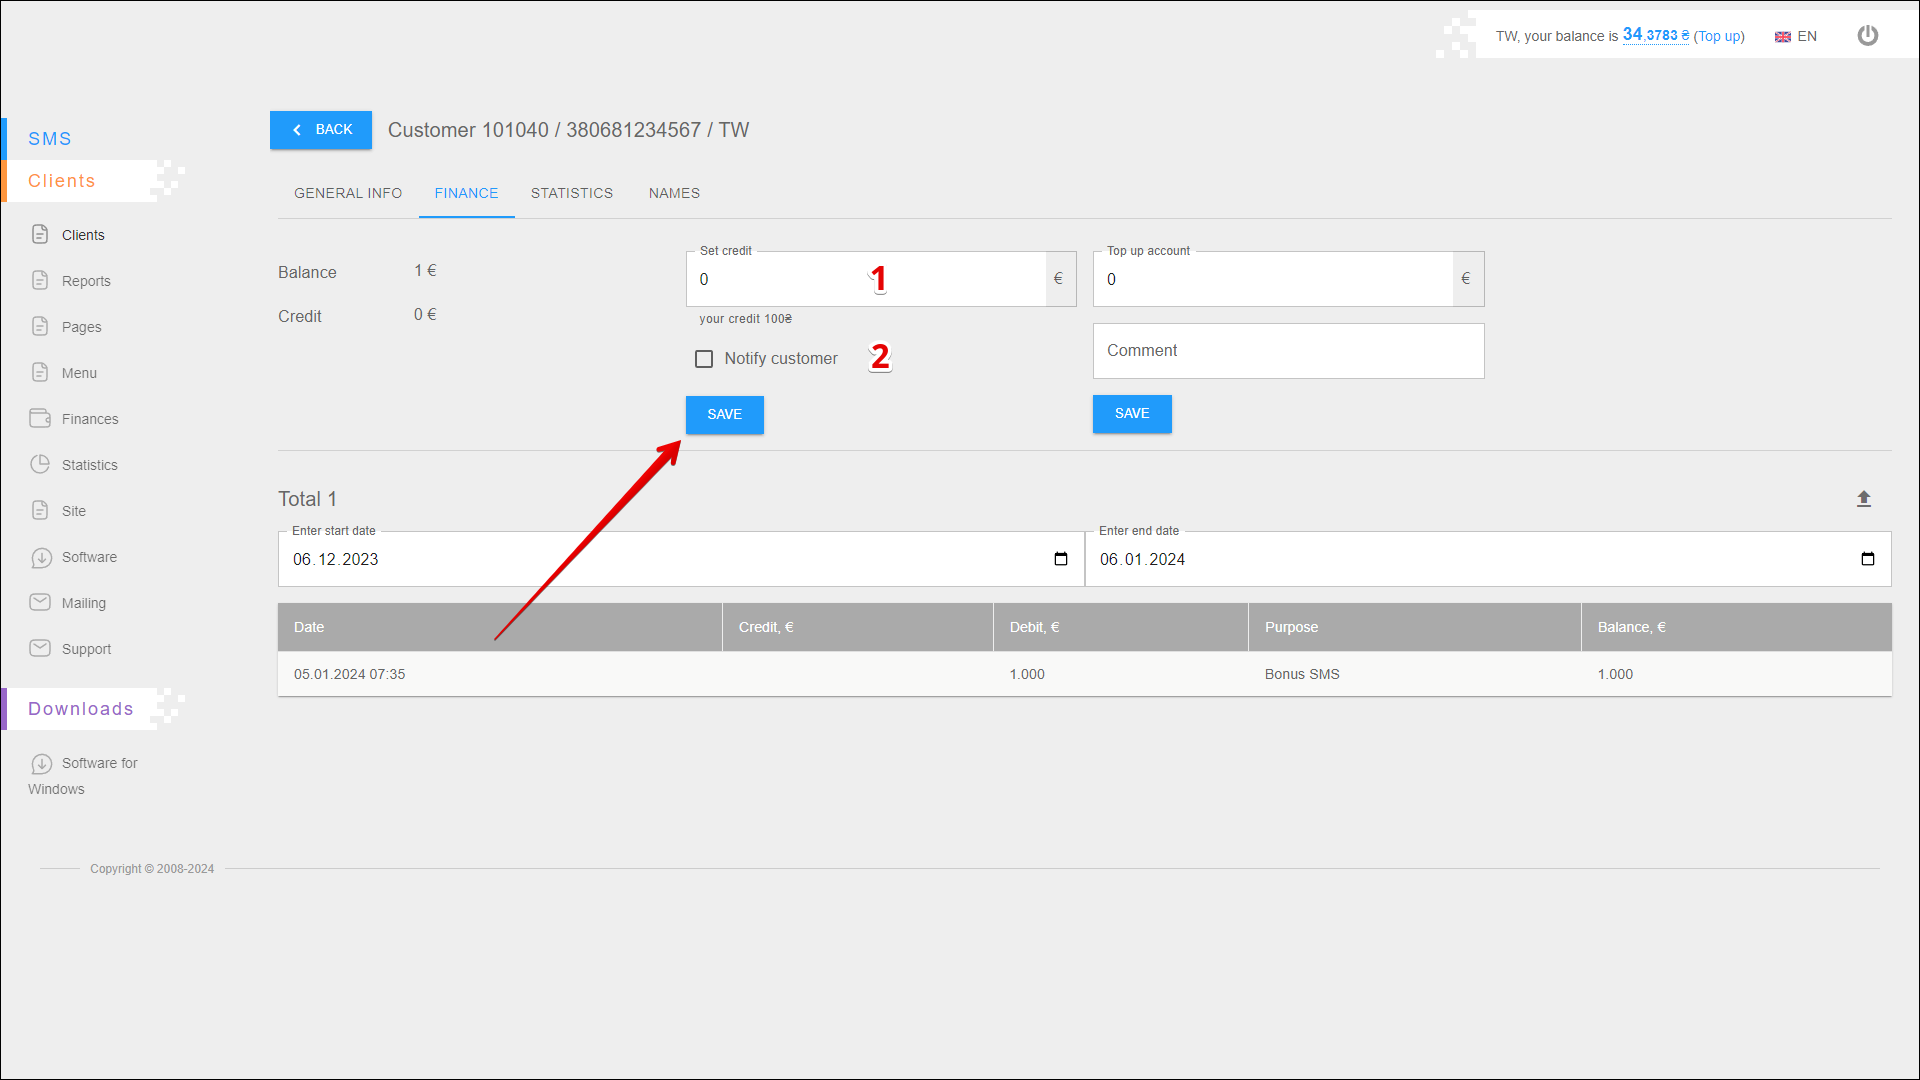
Follow the steps below to set the credit balance:
| № | Action |
|---|---|
| 1 | Enter the amount of the credit |
| 2 | Check the checkbox if it is necessary to notify the customer of a change in credit balance |
Press the SAVE button to save your changes.
Top up account
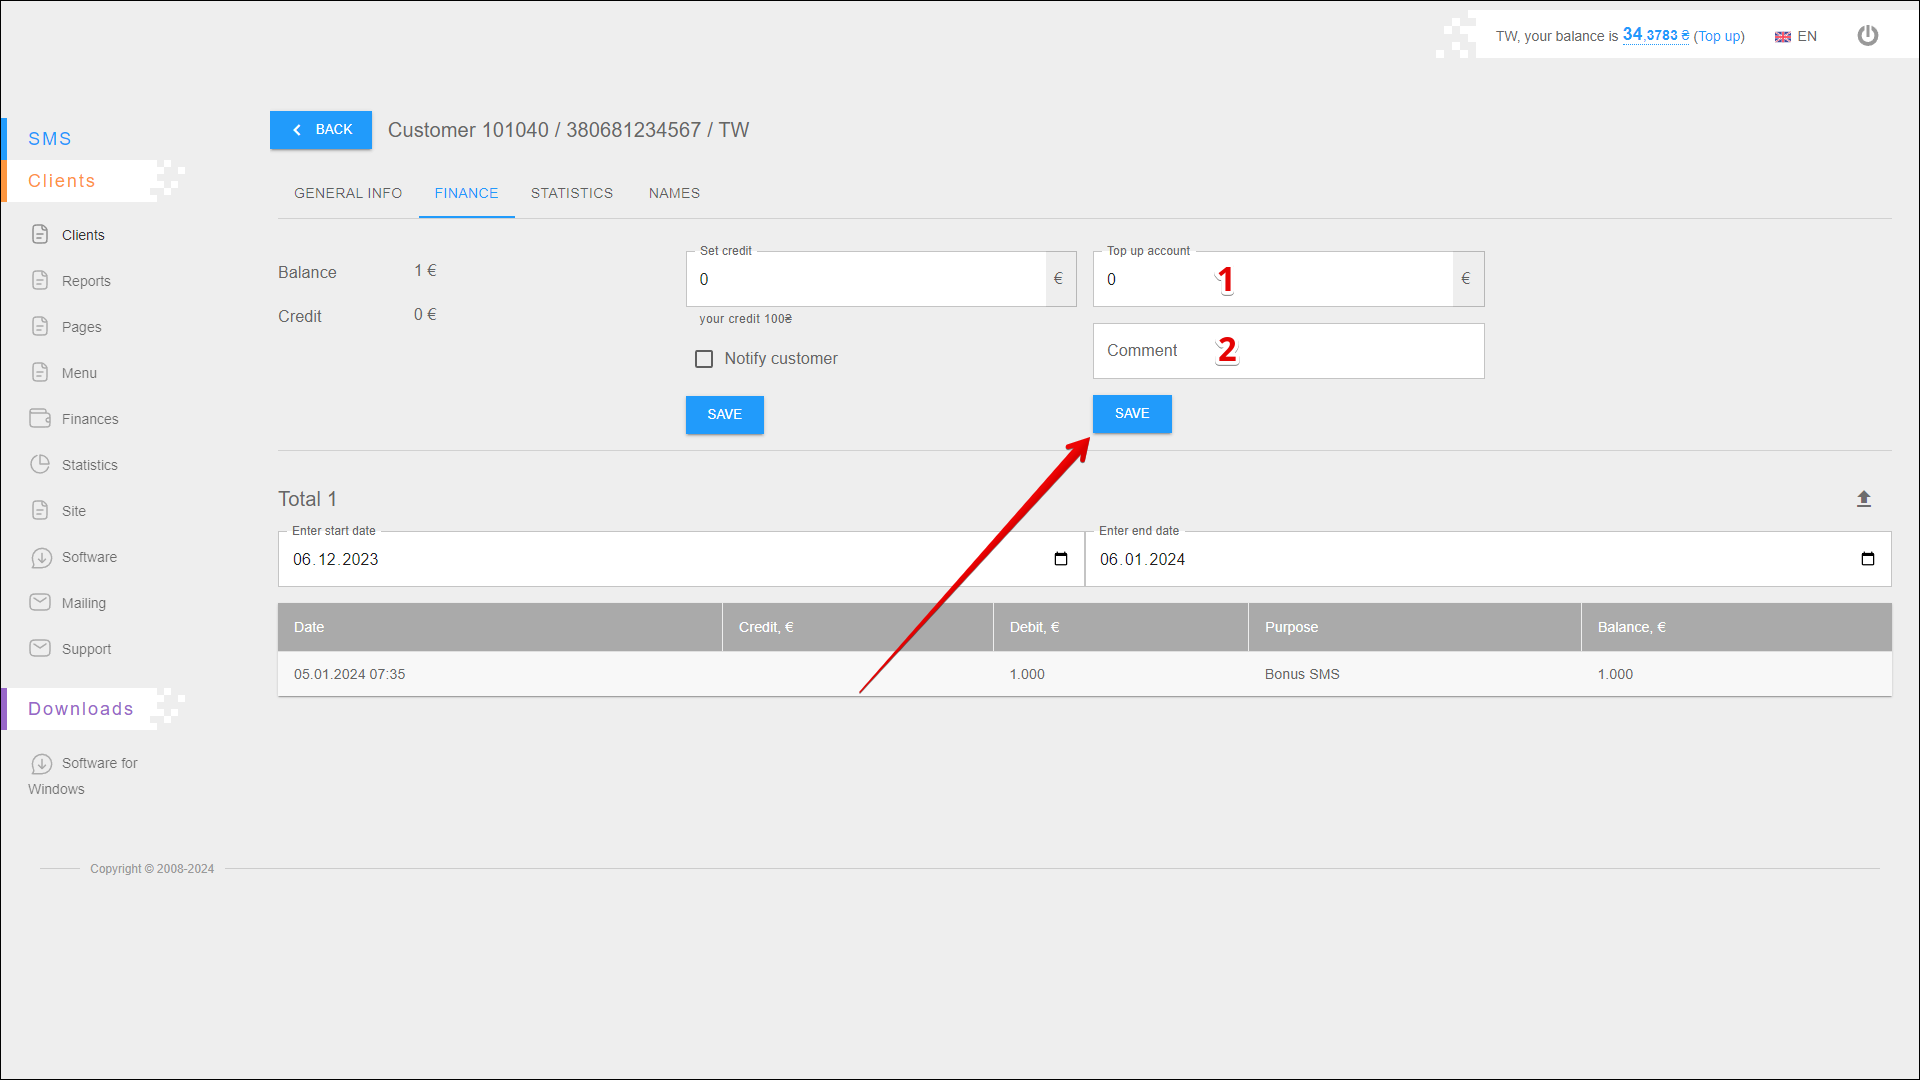
Follow the steps below to top up your client's account:
| № | Action |
|---|---|
| 1 | Enter the amount of top-up |
| 2 | Add a comment if necessary |
Press the SAVE button to top up.
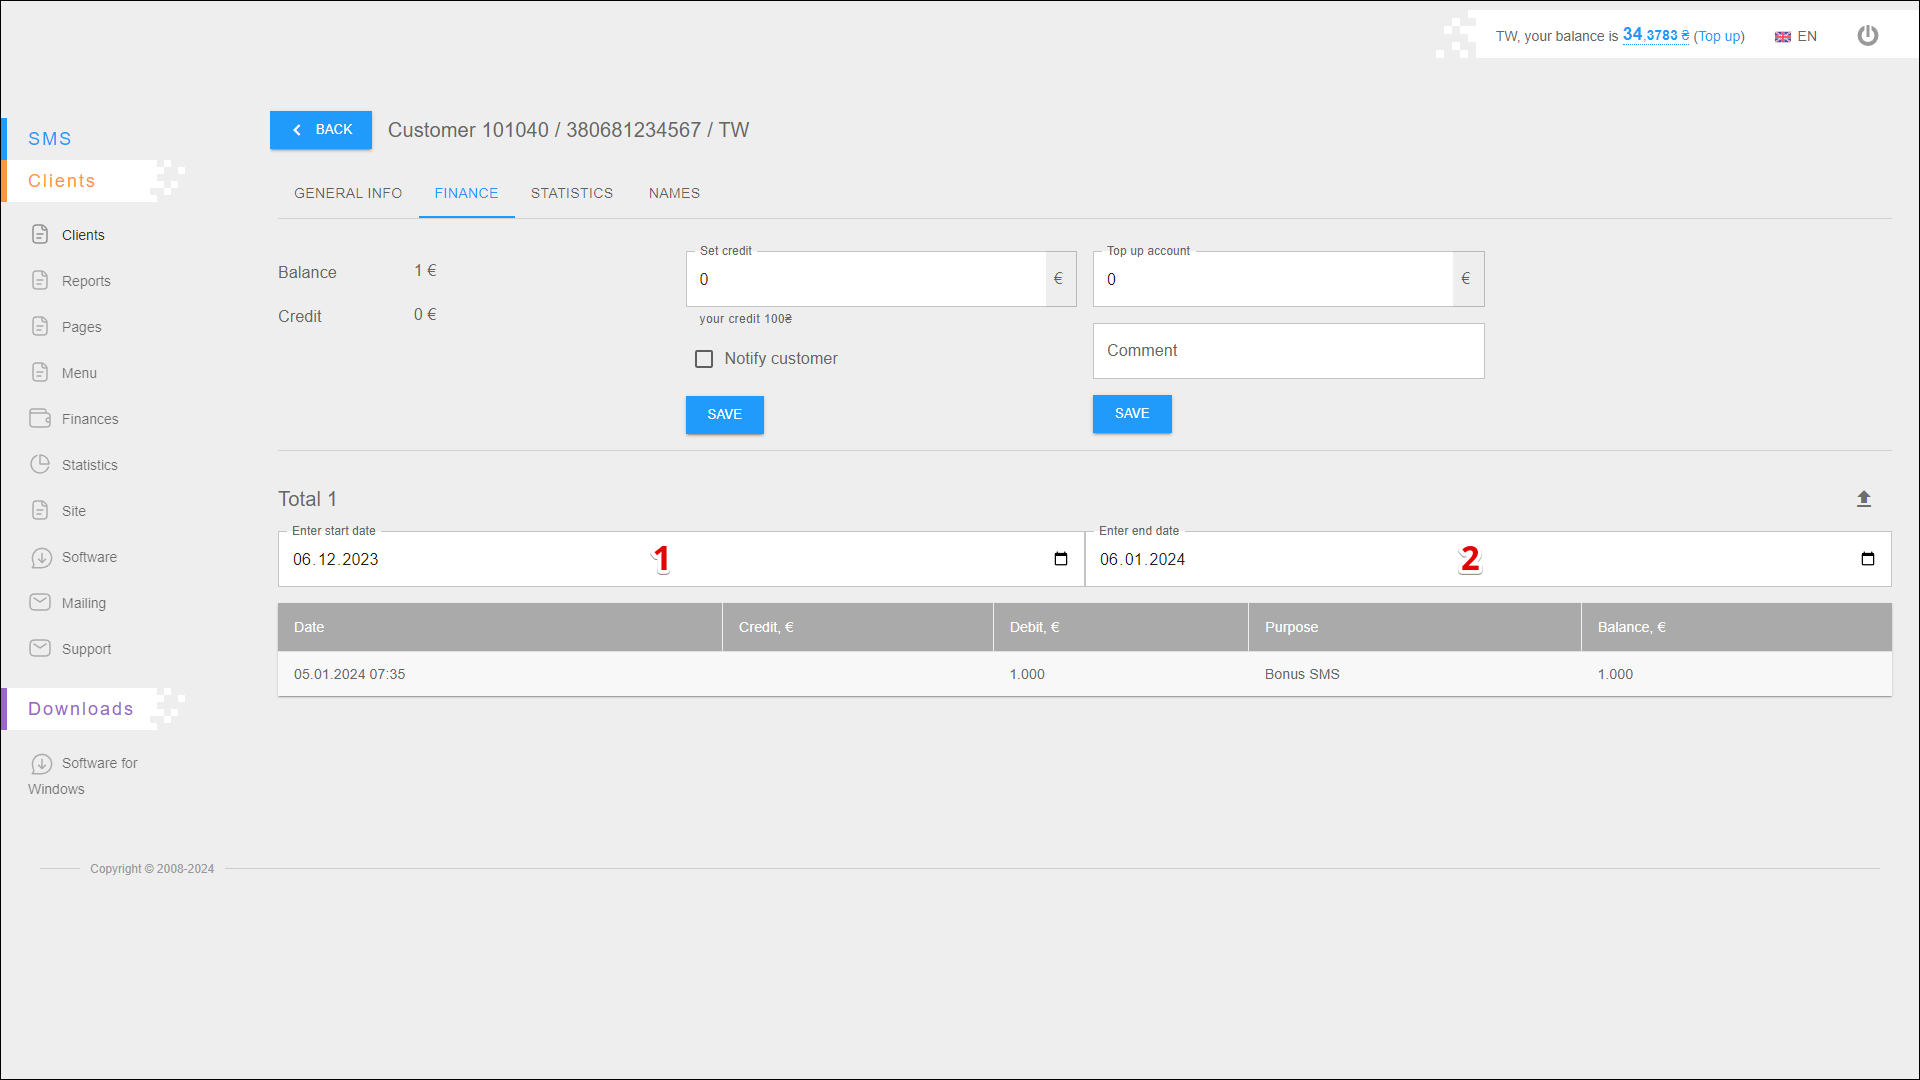
Period selection
To select the time period for which you want to display the transaction history, follow the steps below:
| № | Action |
|---|---|
| 1 | Enter the start date. You can enter the date manually or select it in the calendar, to do this, click the Calendar icon on the right side of the field |
| 2 | Enter the end date. You can enter the date manually or select it in the calendar, to do this, click the Calendar icon on the right side of the field |
After selecting a date, the page will be refresh and display the transaction history for the specified period.
Transactions list
All transaction history of the account balance are located in the table in separate columns:
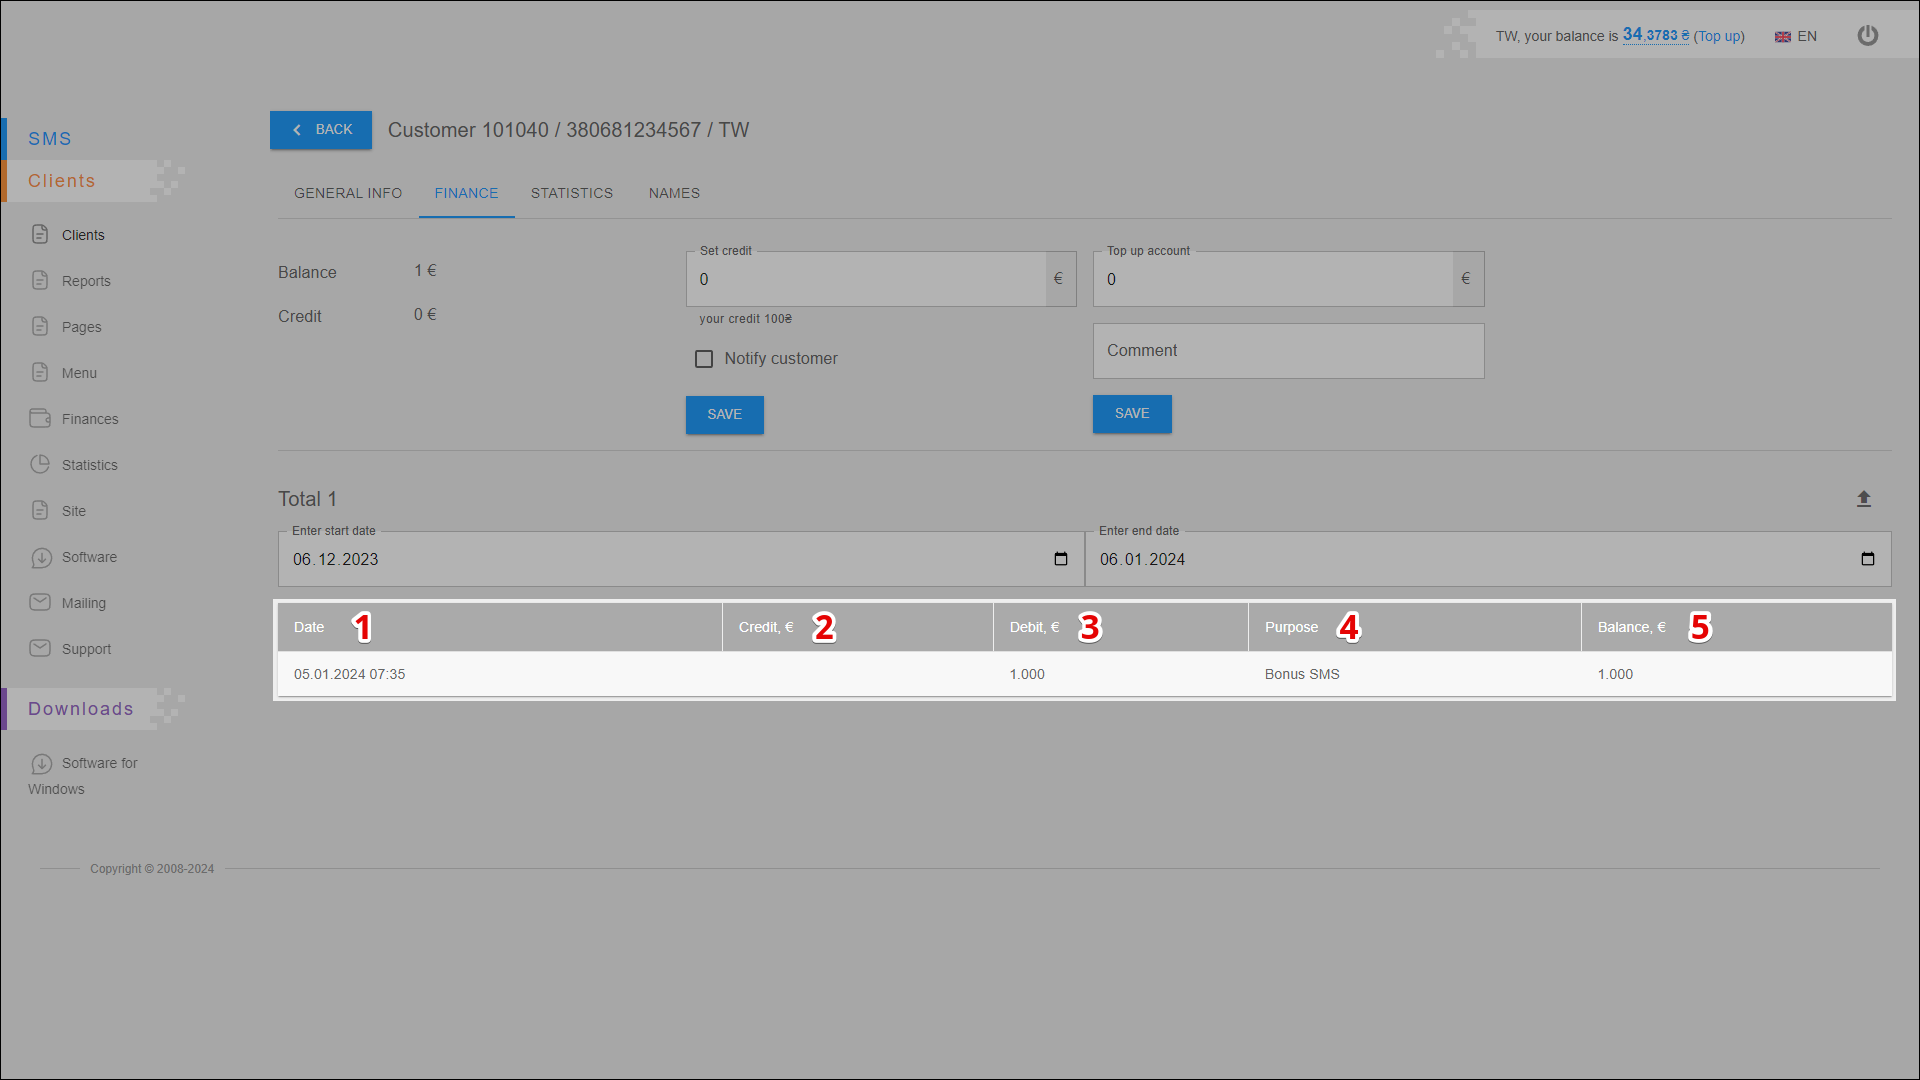
| № | Column | Description |
|---|---|---|
| 1 | Date | Date and time of the transaction (sending a message or balance top-up) |
| 2 | Credit | Mailing costs (in the currency of the client's account) |
| 3 | Debit | Account top-up (in the currency of the client's account) |
| 4 | Purpose | Transaction assignment |
| 5 | Balance | Balance status after the transaction (in the currency of the client's account) |
Exporting a transaction history
To export transaction history click the Export button icon.
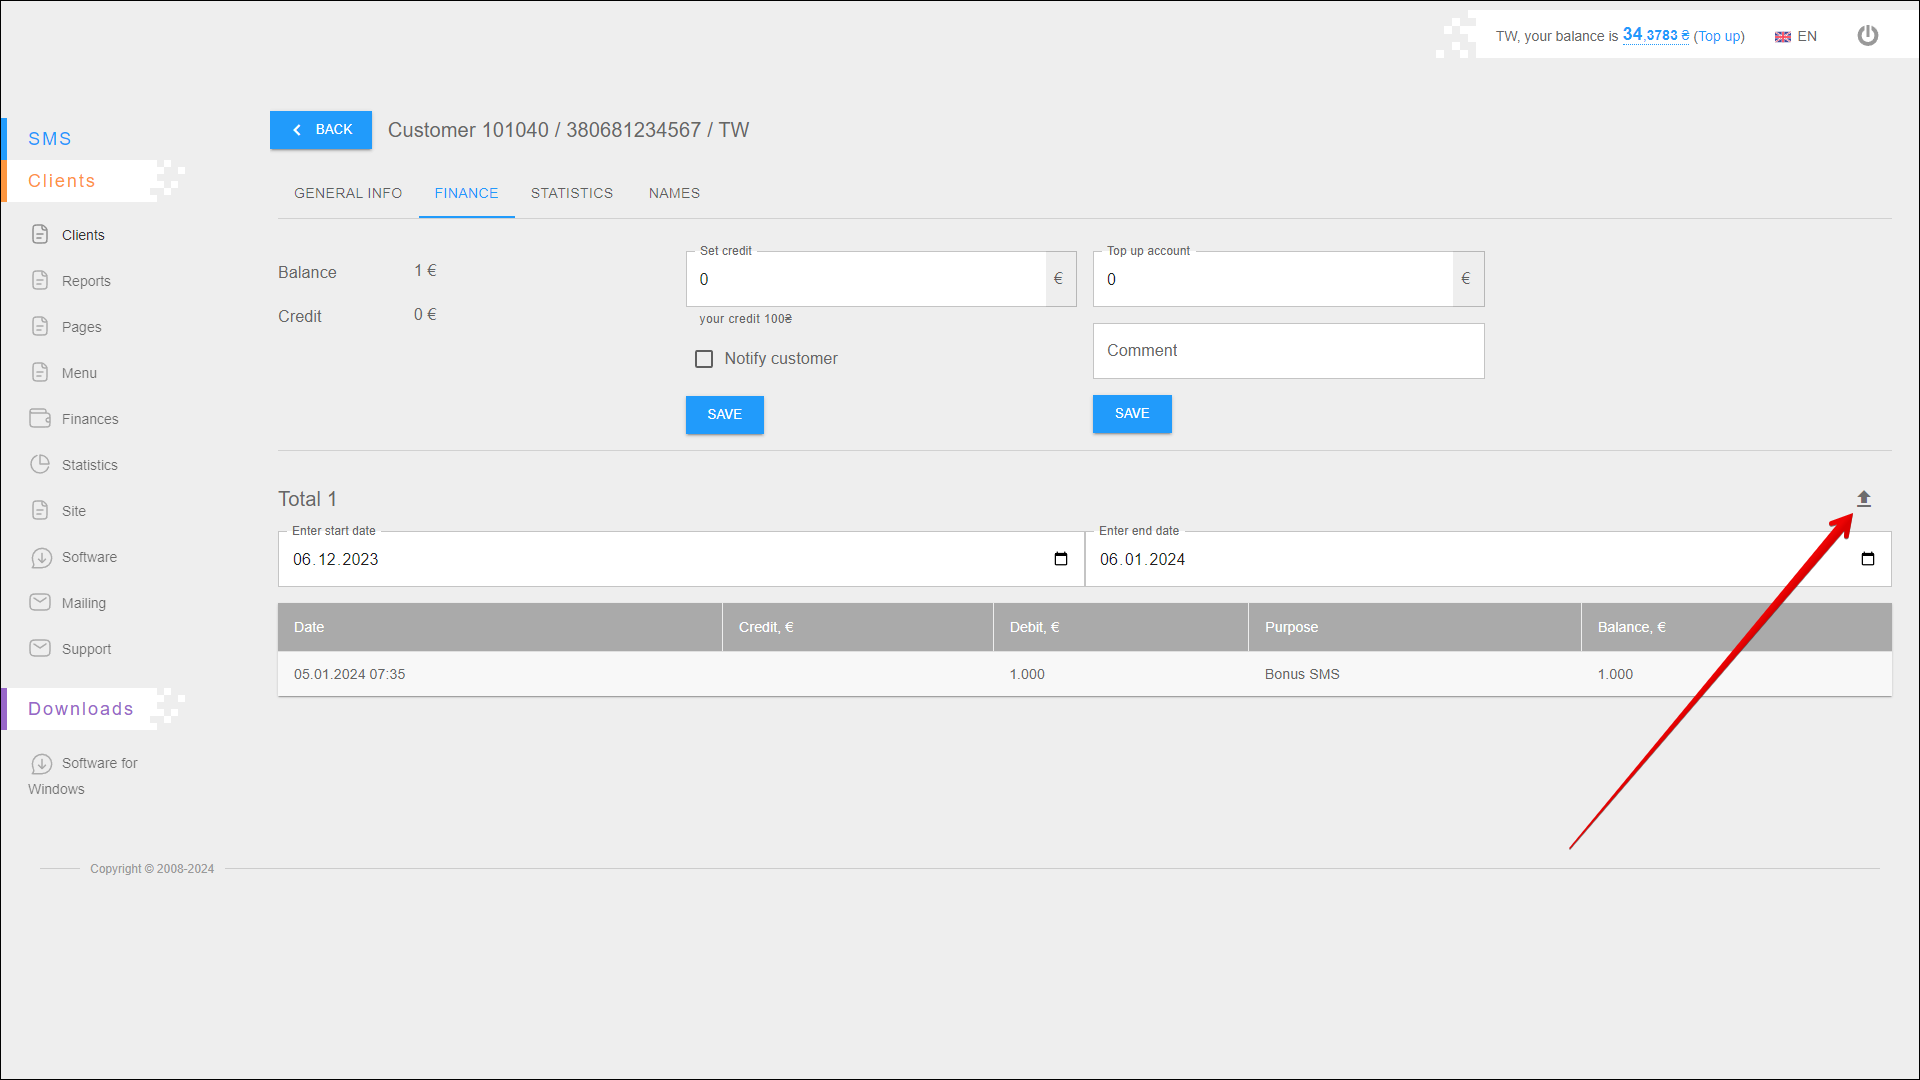
After pressing the Export button icon, the report will be saved on your device in an .xlsx file.
STATISTICS
The STATISTICS tab contains several reports on which you can view the statistics and effectiveness of the mailing.
GROUPING BY DAY
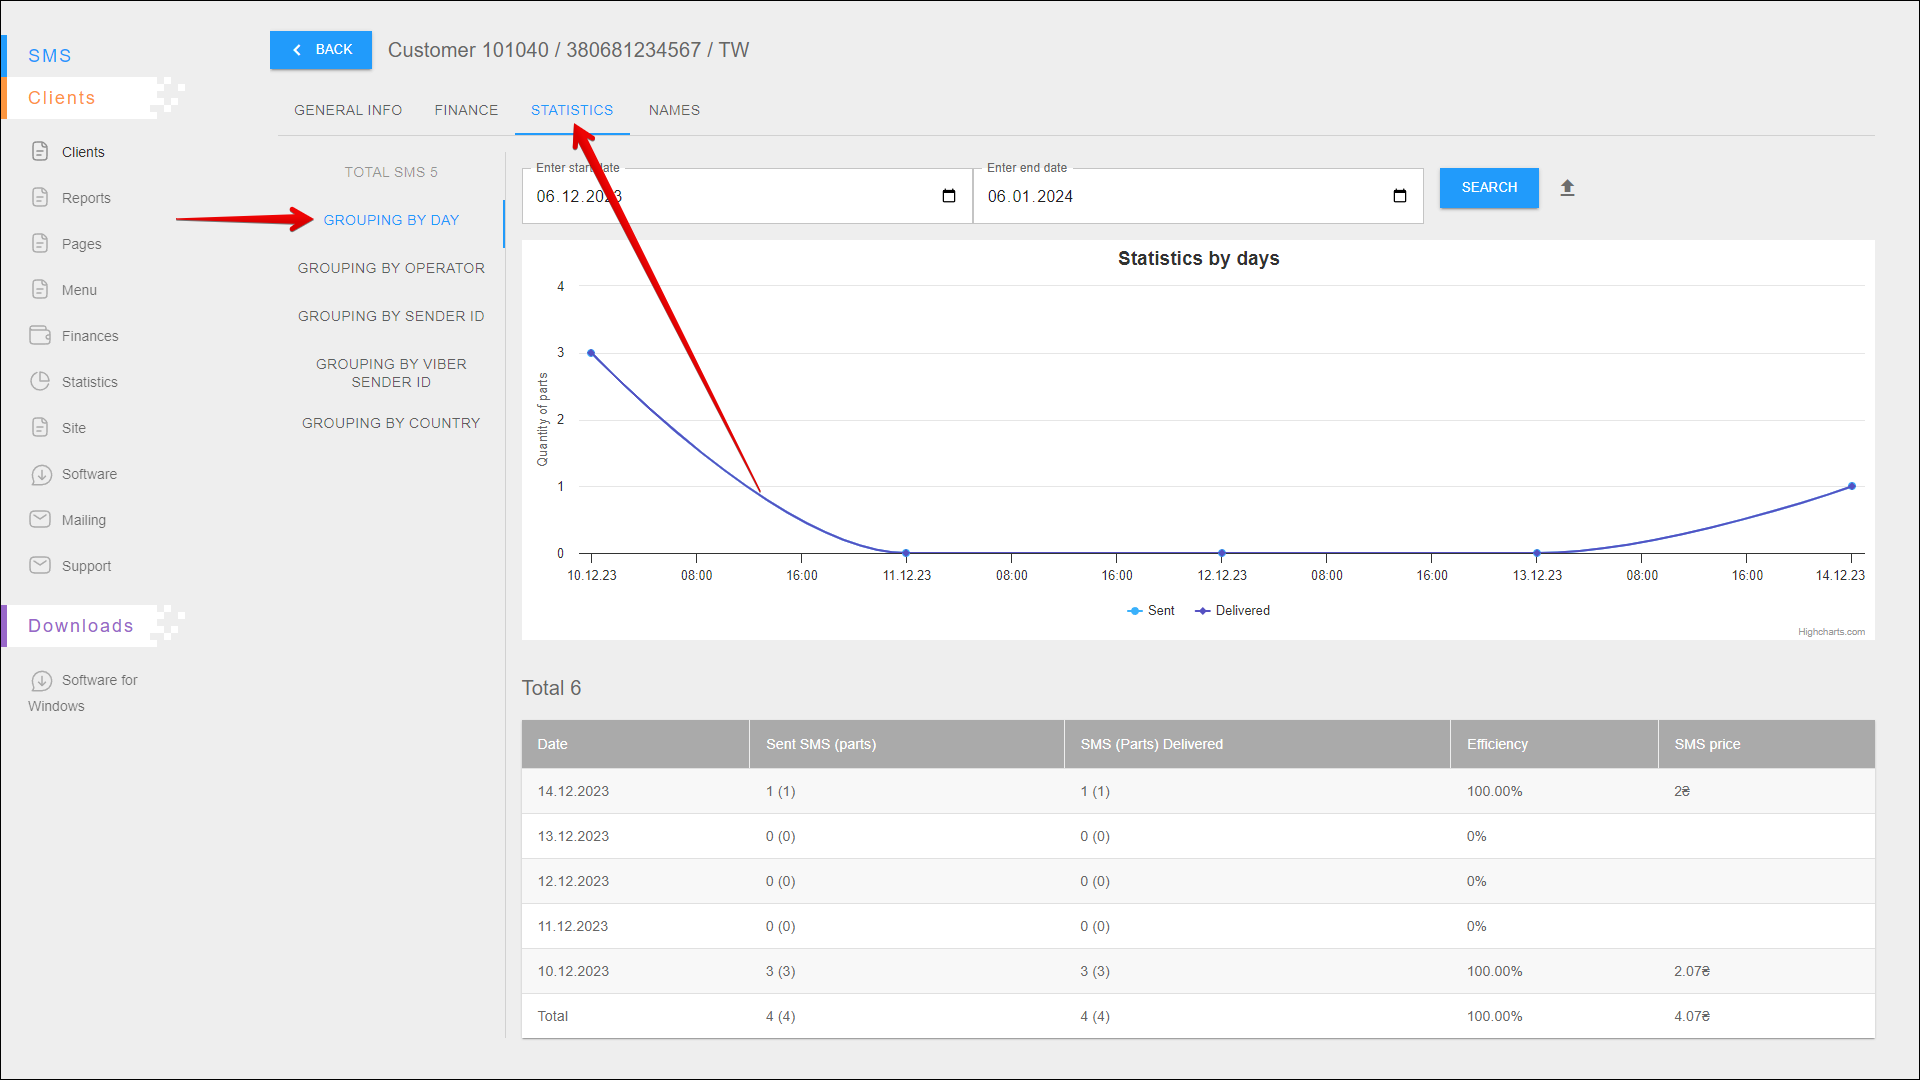
In this report you can view statistics by day and also check the efficiency of the mailing.
To open this report, open the STATISTICS tab and select the GROUPING BY DAY report.
Period selection
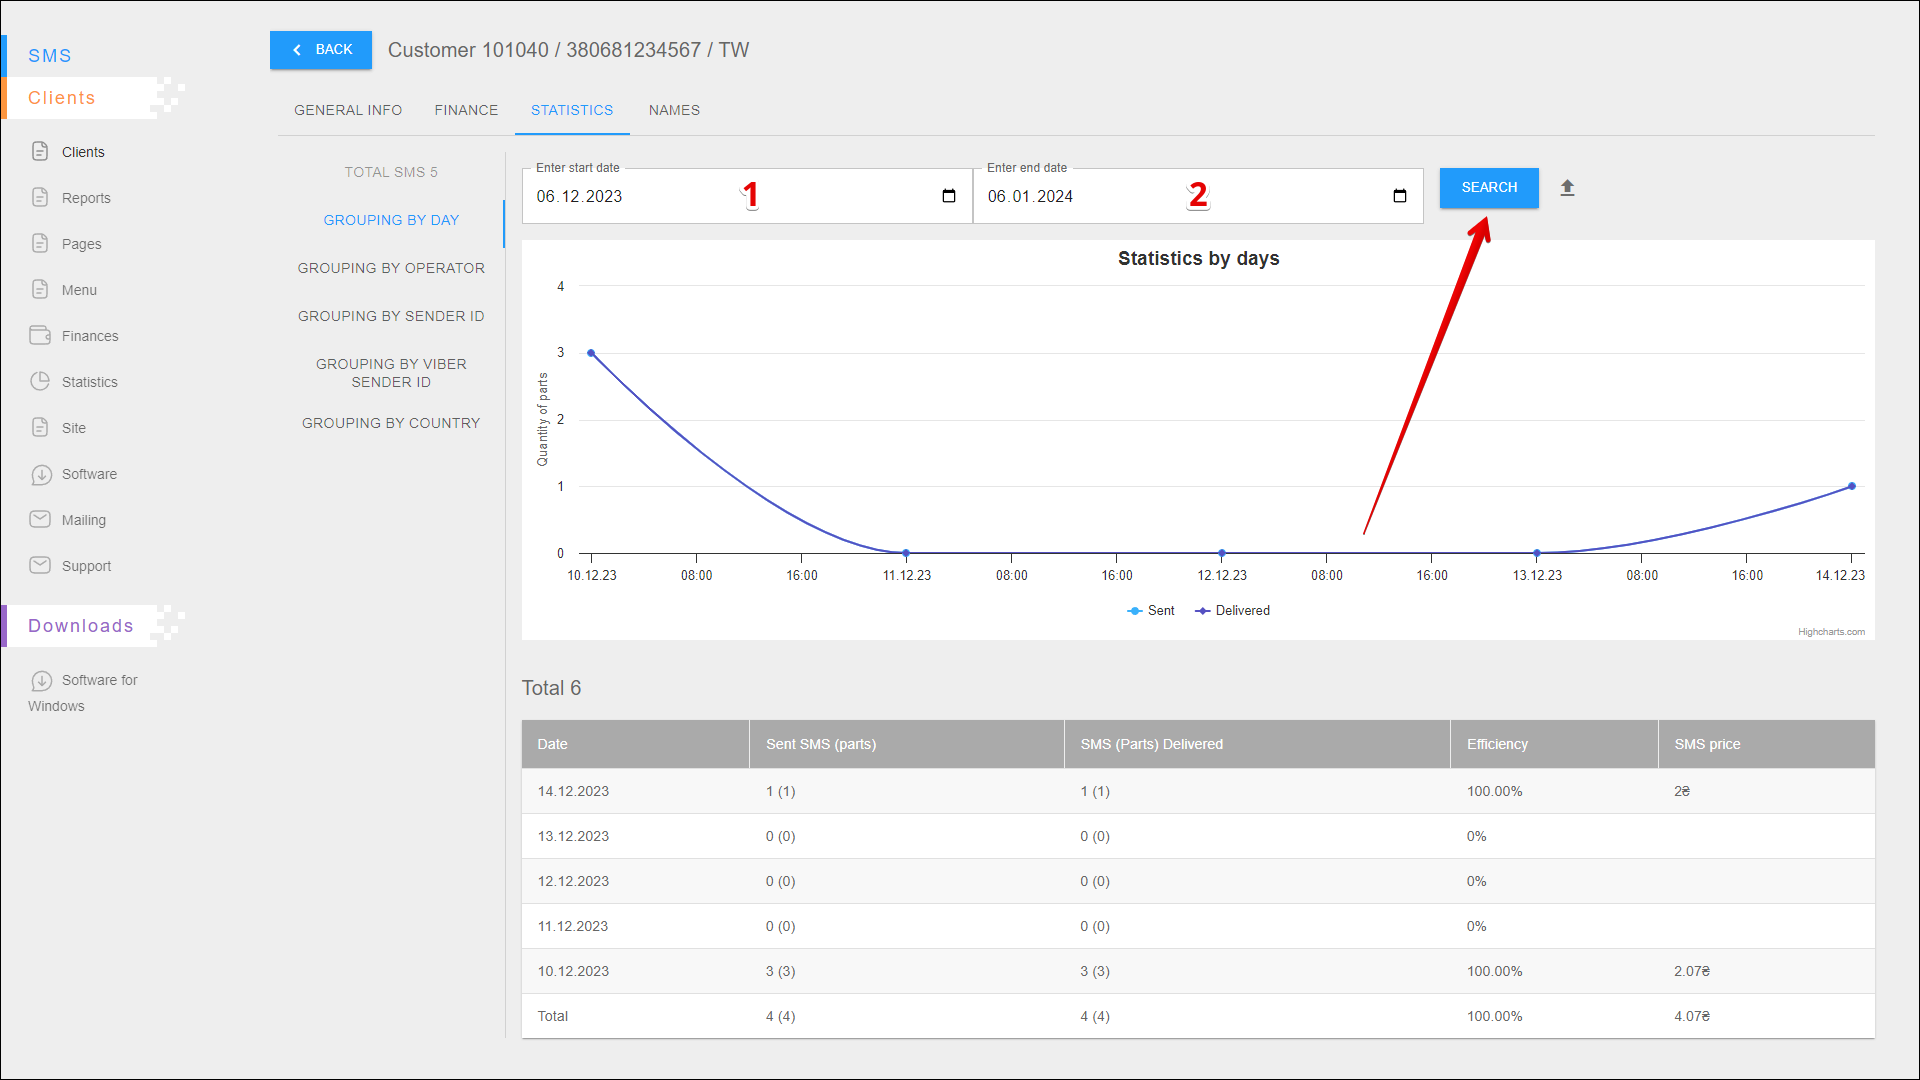
To select the time period for which you want to display statistic, follow the steps below:
| № | Action |
|---|---|
| 1 | Enter the start date. You can enter the date manually or select it in the calendar, to do this, click the Calendar icon on the right side of the field |
| 2 | Enter the end date. You can enter the date manually or select it in the calendar, to do this, click the Calendar icon on the right side of the field |
After selecting a date, click the SEARCH button. The page will be refreshed and display statistics for the specified period.
Exporting a report
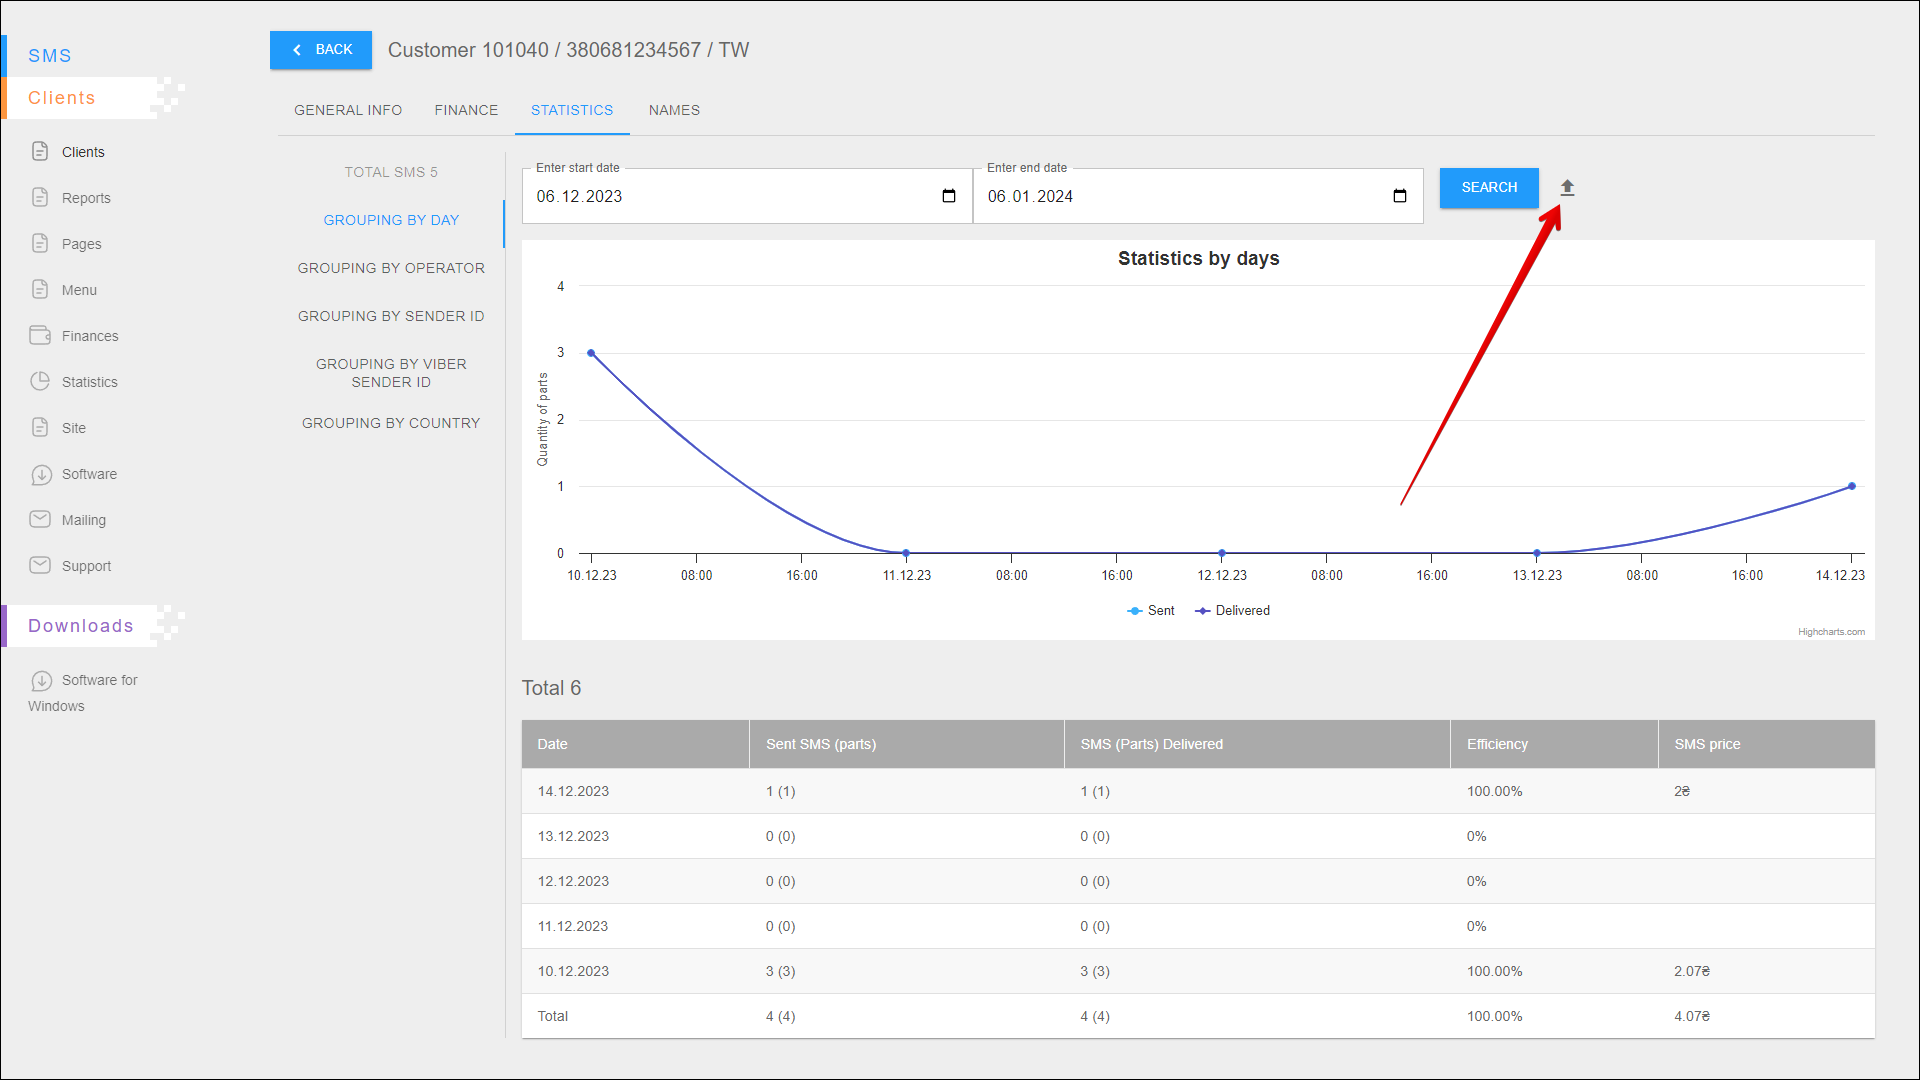
To export statistical reporting click the Export button icon to the right of the SEARCH button.
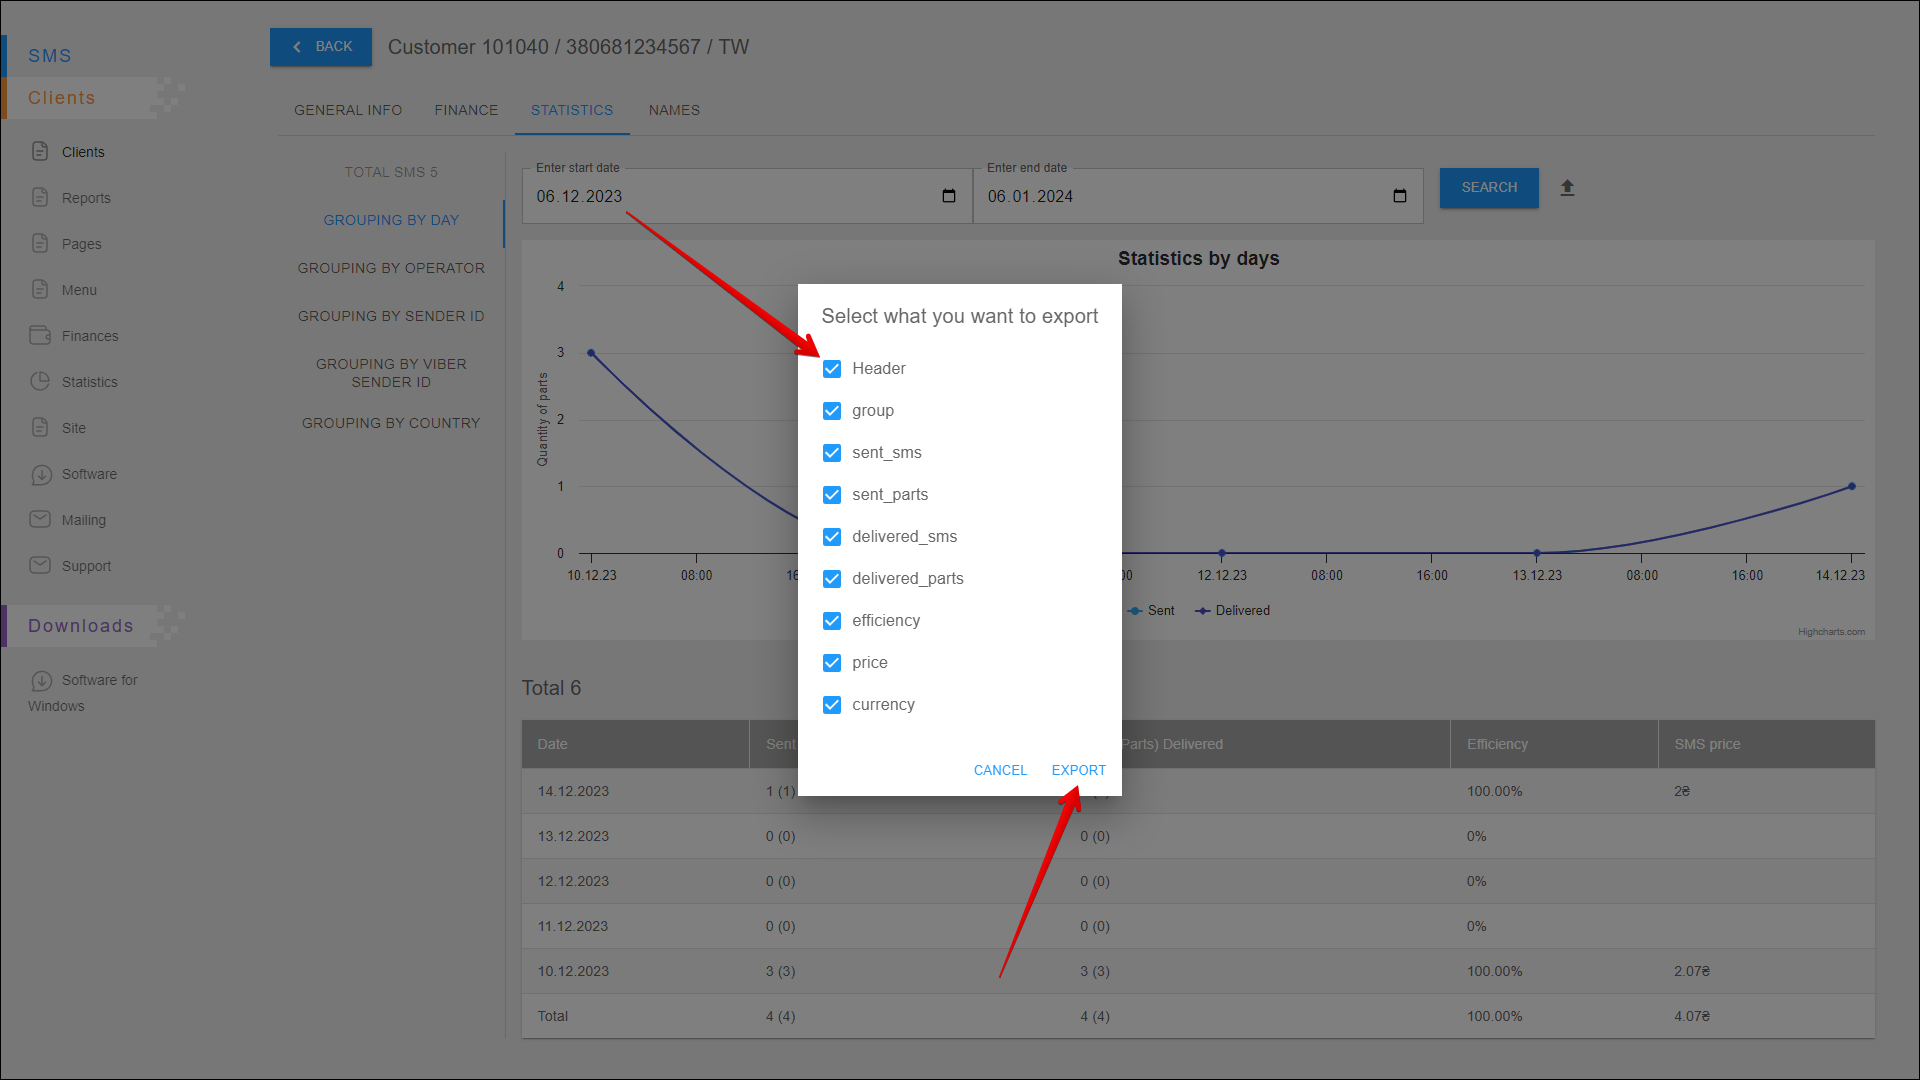
A new pop-up window will open where you need to select the data you want to export. After selecting the data, click the EXPORT button to export. To cancel, click the CANCEL button.
After pressing the EXPORT button, the report will be saved on your device in an .xlsx file.
Statistics chart
This chart displays the number of sent and delivered messages for each day of the specified period.
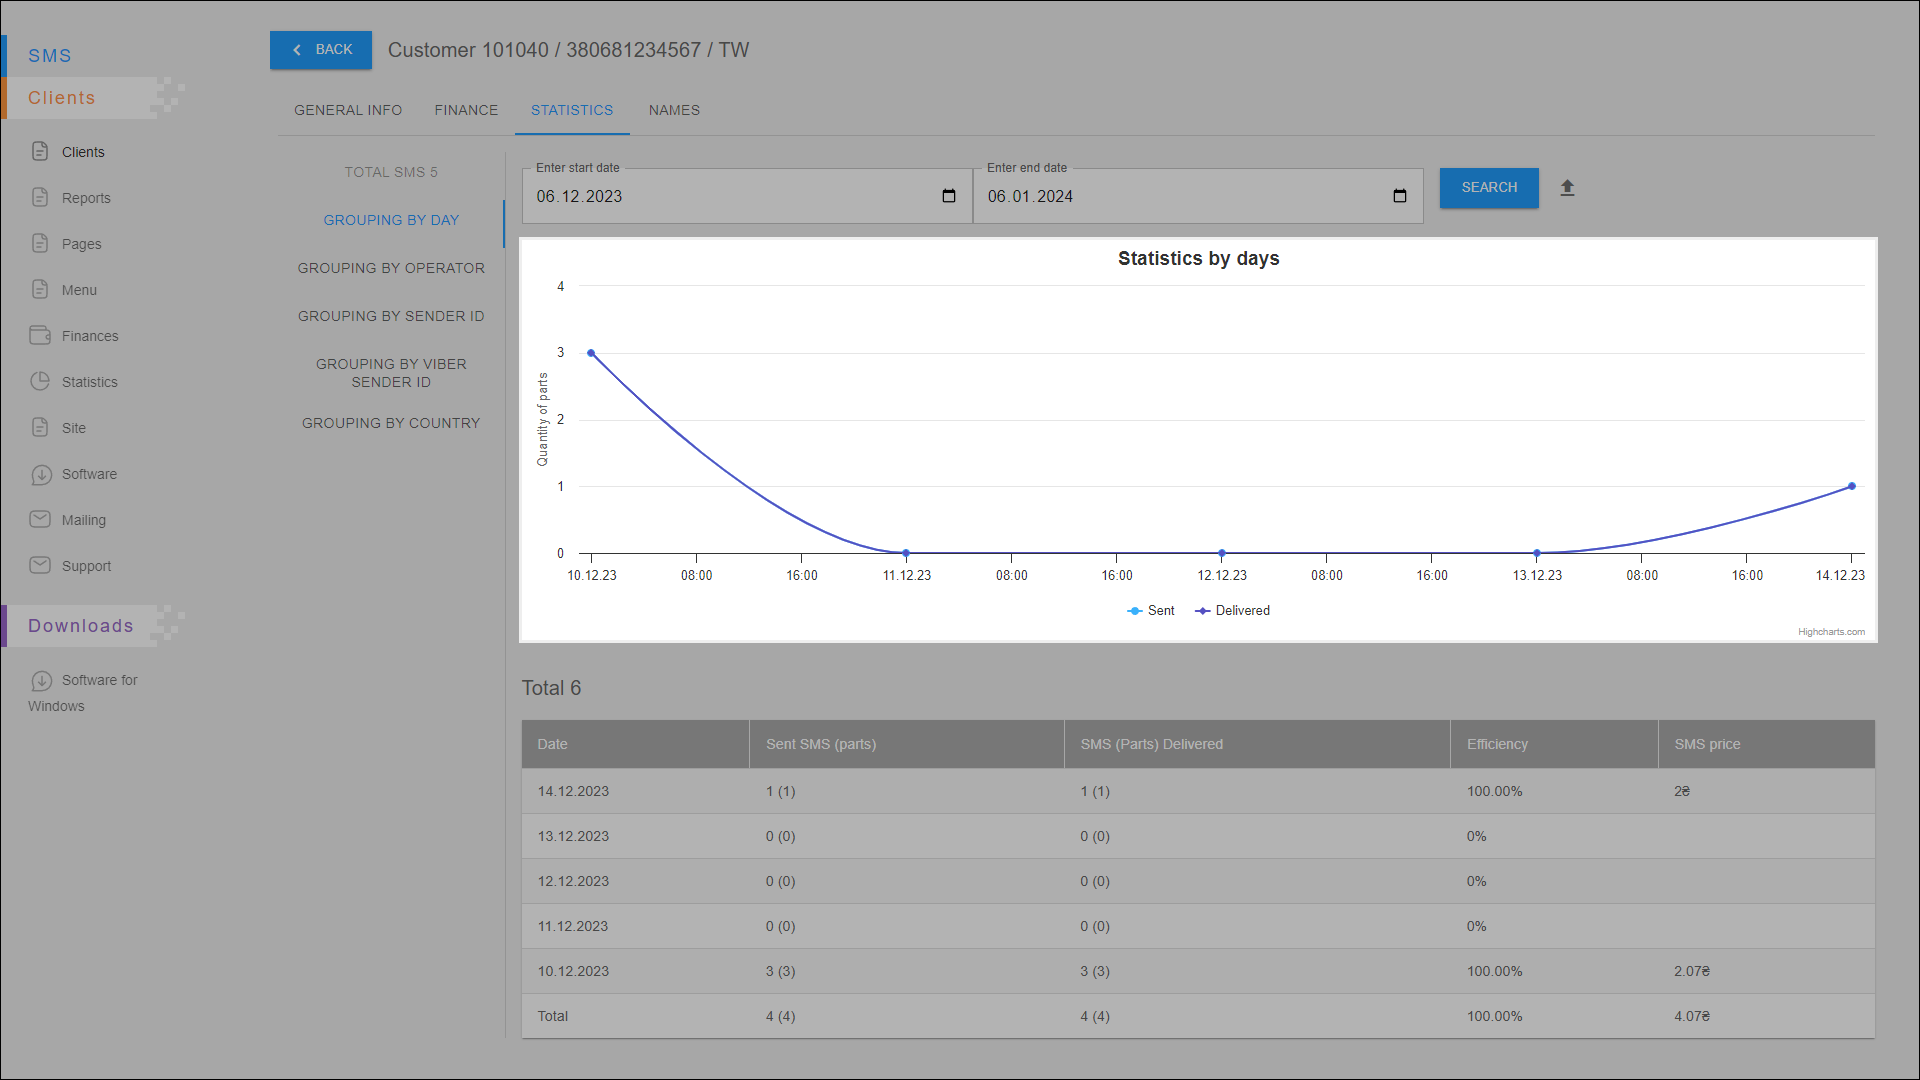
Blue plot - number of messages sent. Purple plot - number of delivered messages.
Statistics table
All statistical data are arranged in the table in separate columns:
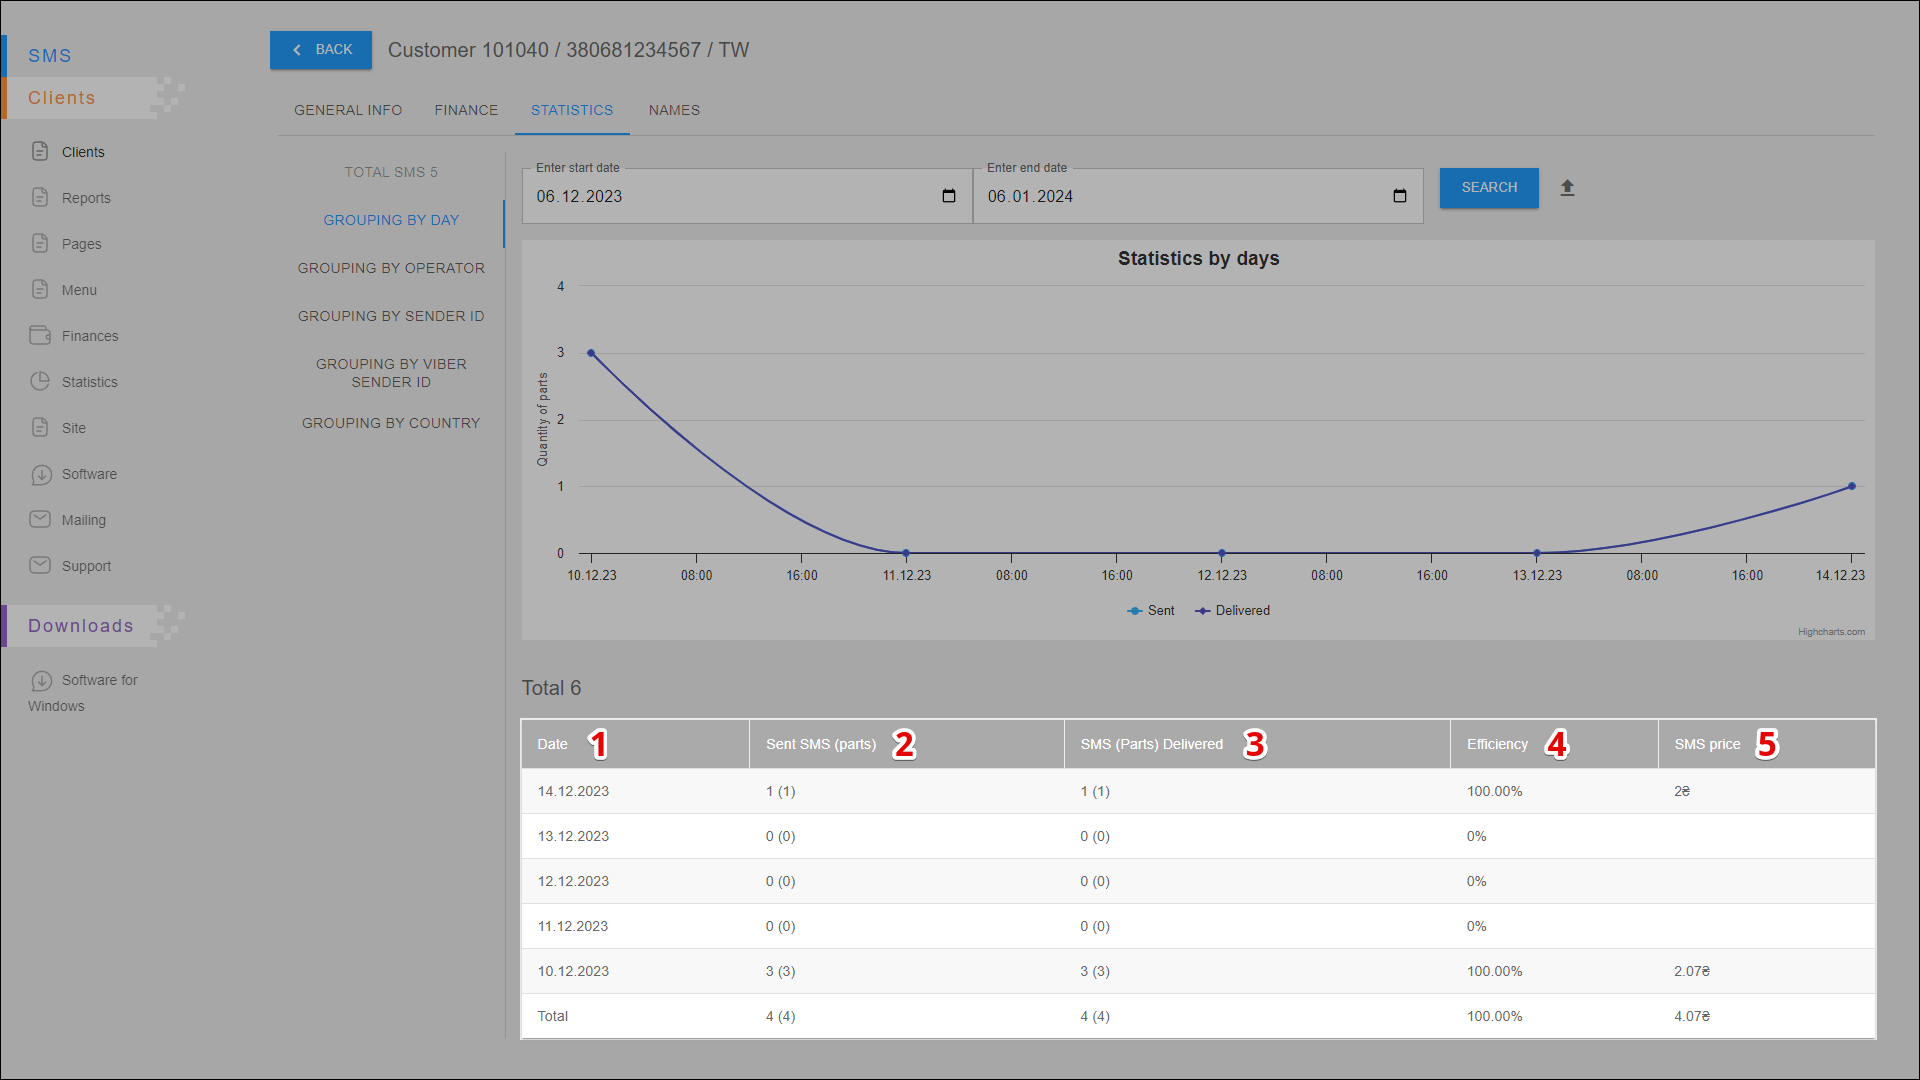
| № | Column | Description |
|---|---|---|
| 1 | Date | Date of sending messages |
| 2 | Send SMS (parts) | Number of sent messages (parts) |
| 3 | SMS (Parts) Delivered | Number of delivered messages (parts) |
| 4 | Efficiency | Mailing efficiency (number of delivered messages out of the total number of sent messages ) |
| 5 | SMS Price | Messaging costs |
GROUPING BY OPERATOR
In this report you can view statistics by operators and also check the efficiency of the mailing.
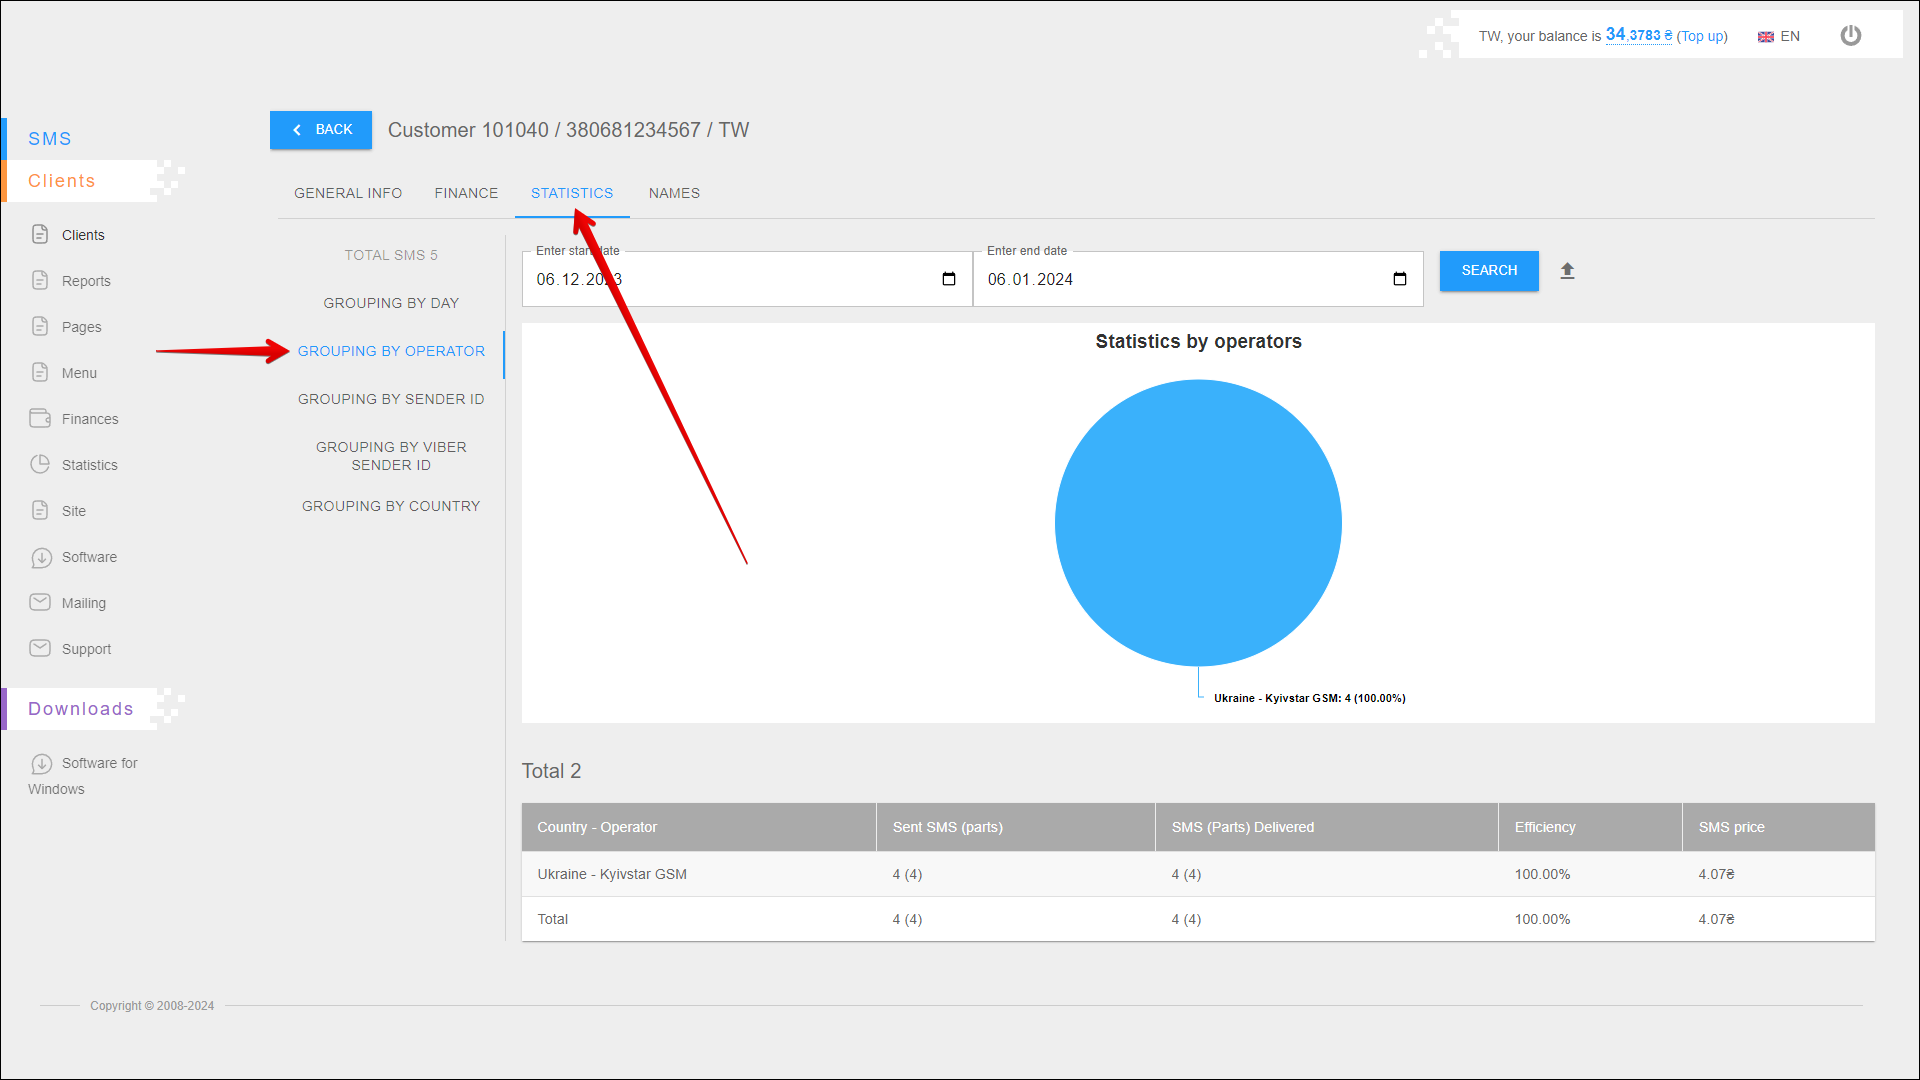
To open this report, open the STATISTICS tab and select the GROUPING BY OPERATOR report.
Period selection
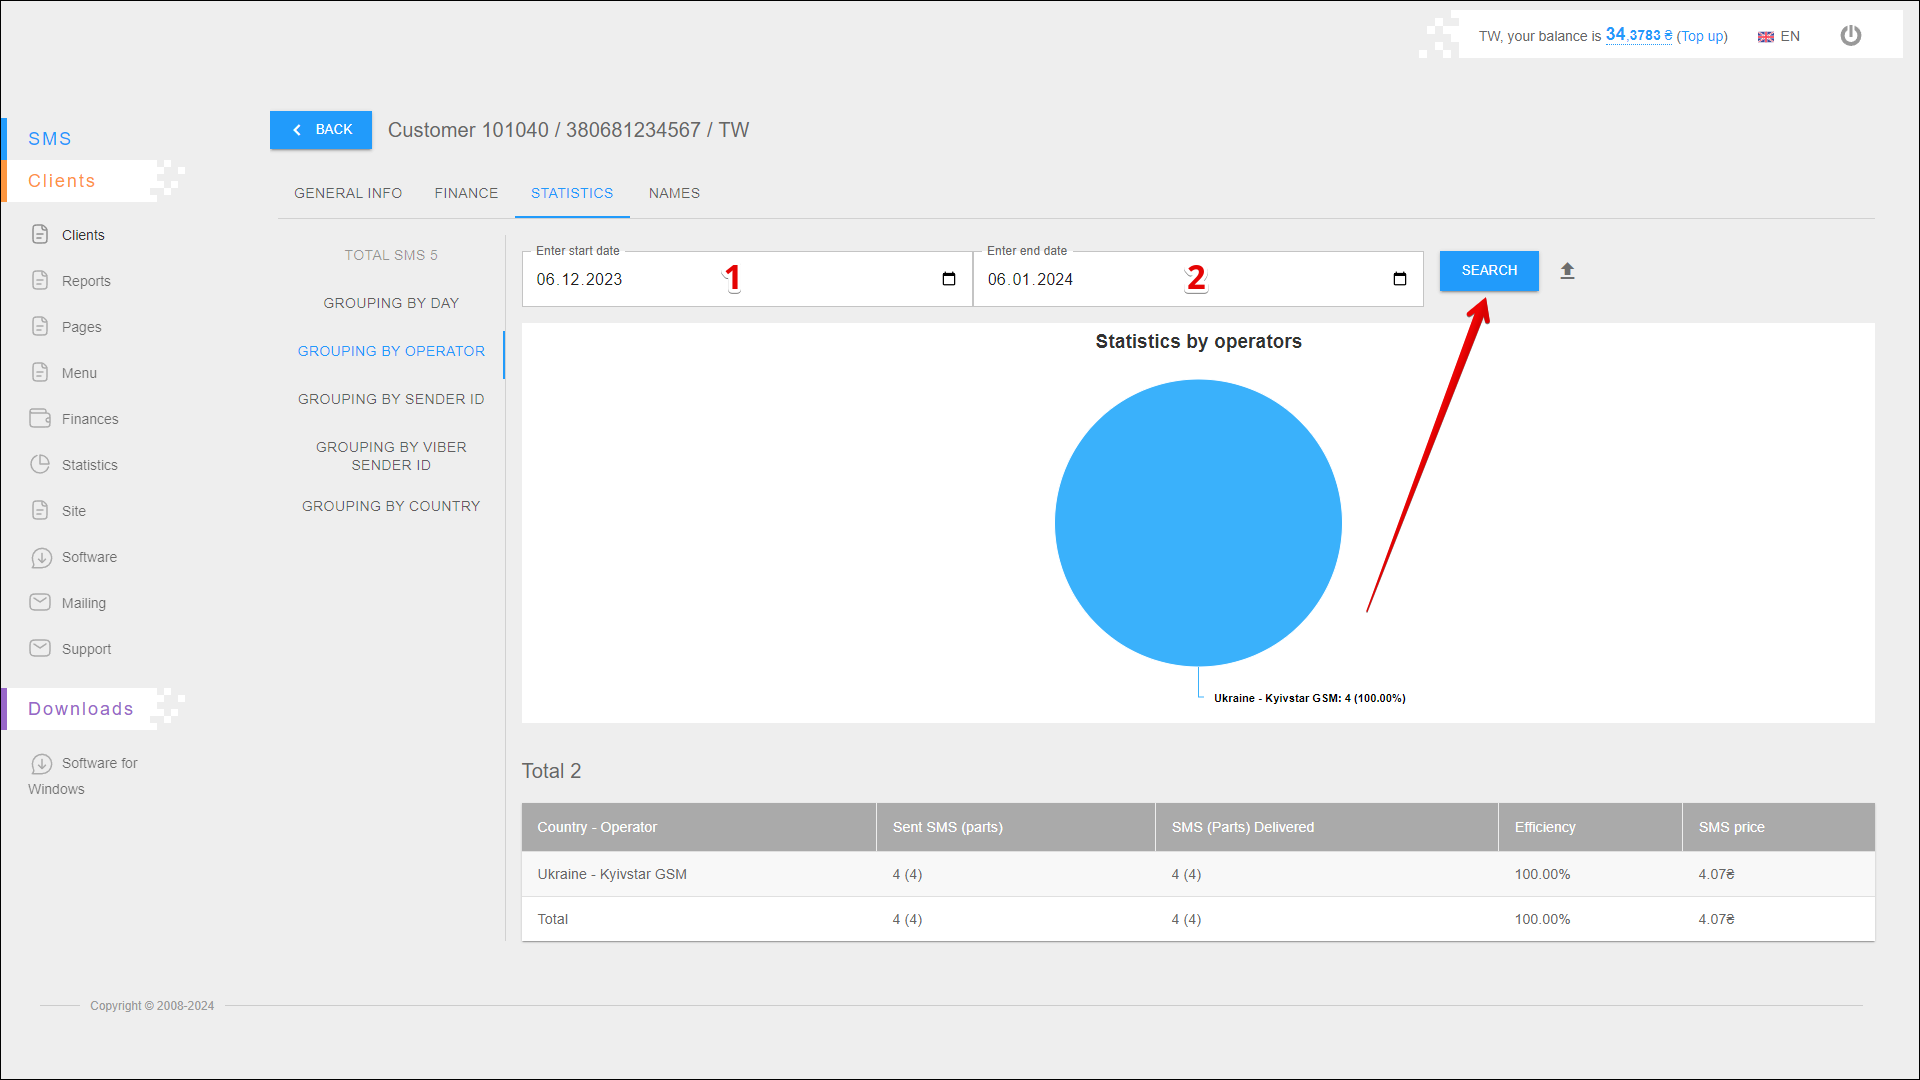
To select the time period for which you want to display statistic, follow the steps below:
| № | Action |
|---|---|
| 1 | Enter the start date. You can enter the date manually or select it in the calendar, to do this, click the Calendar icon on the right side of the field |
| 2 | Enter the end date. You can enter the date manually or select it in the calendar, to do this, click the Calendar icon on the right side of the field |
After selecting a date, click the SEARCH button. The page will be refreshed and display statistics for the specified period.
Exporting a report
To export statistical reporting click the Export button icon to the right of the SEARCH button.
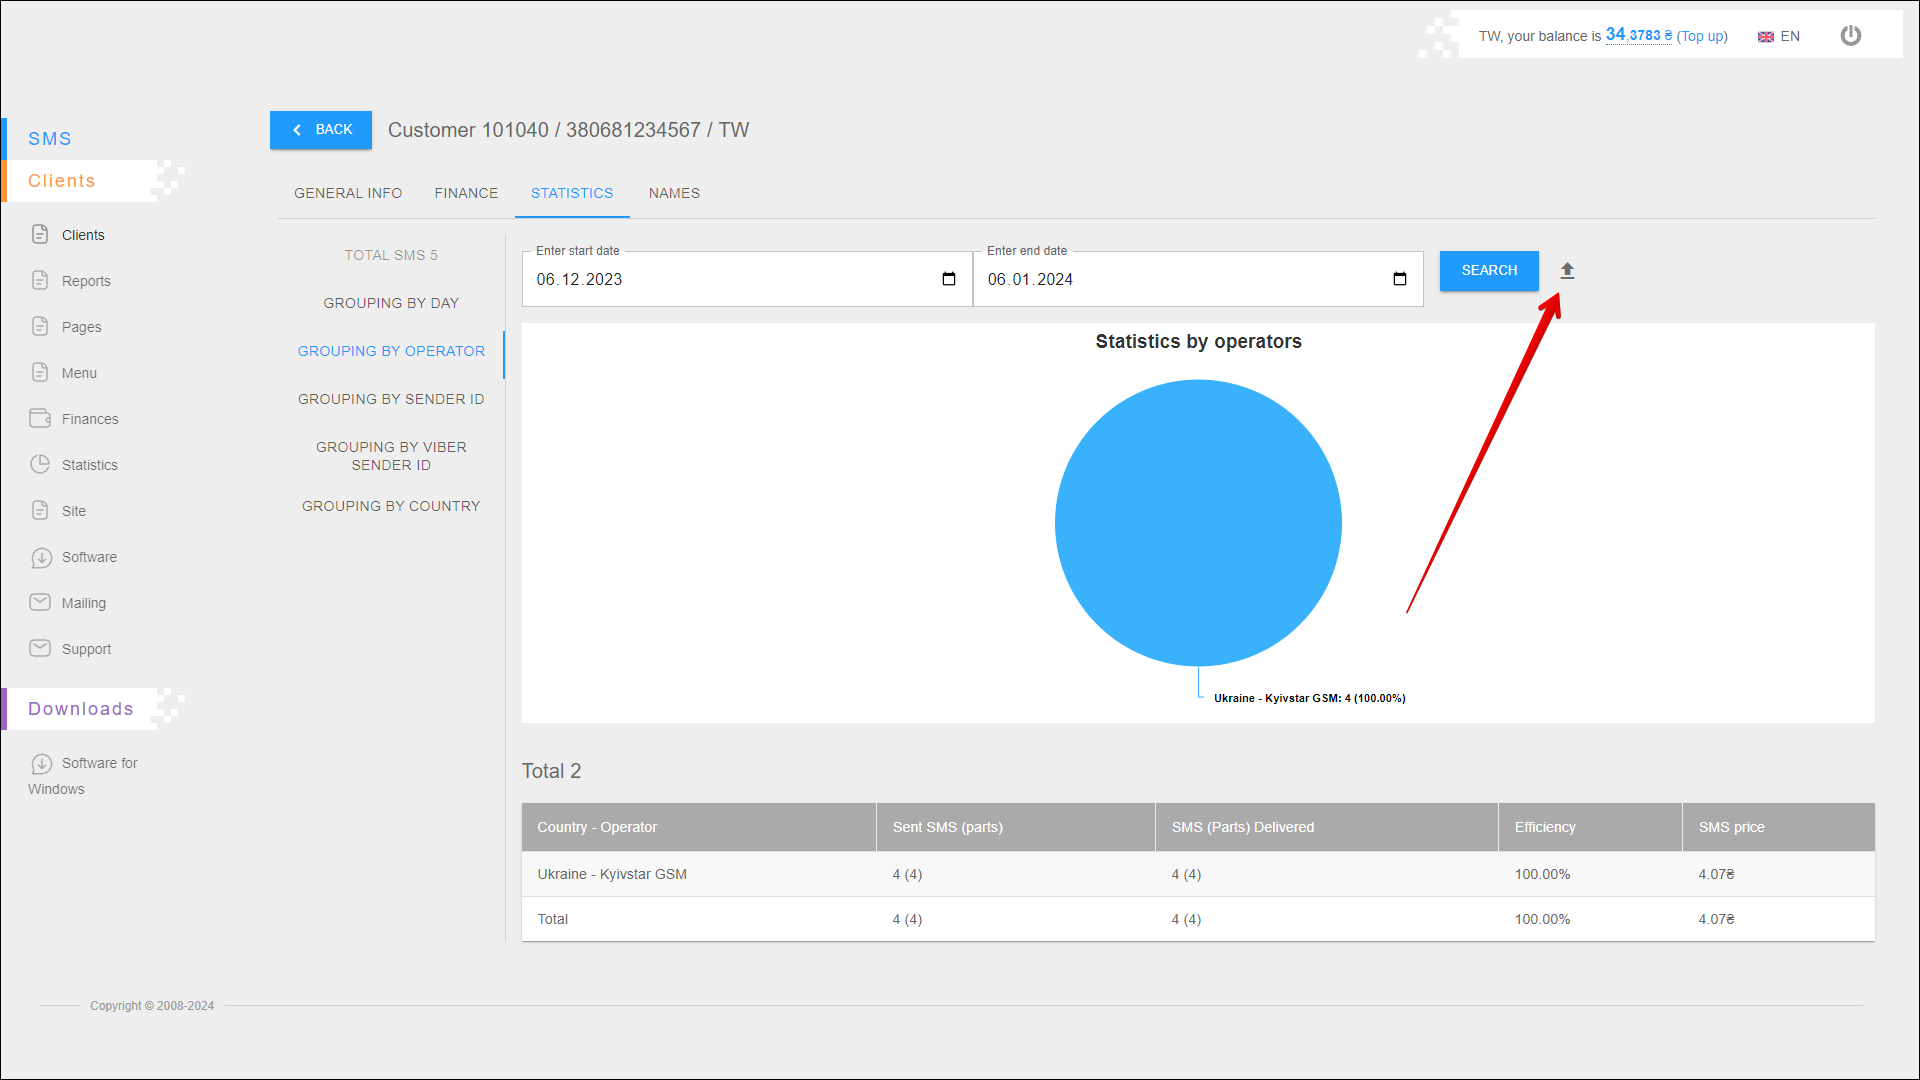
A new pop-up window will open where you need to select the data you want to export. After selecting the data, click the EXPORT button to export. To cancel, click the CANCEL button.
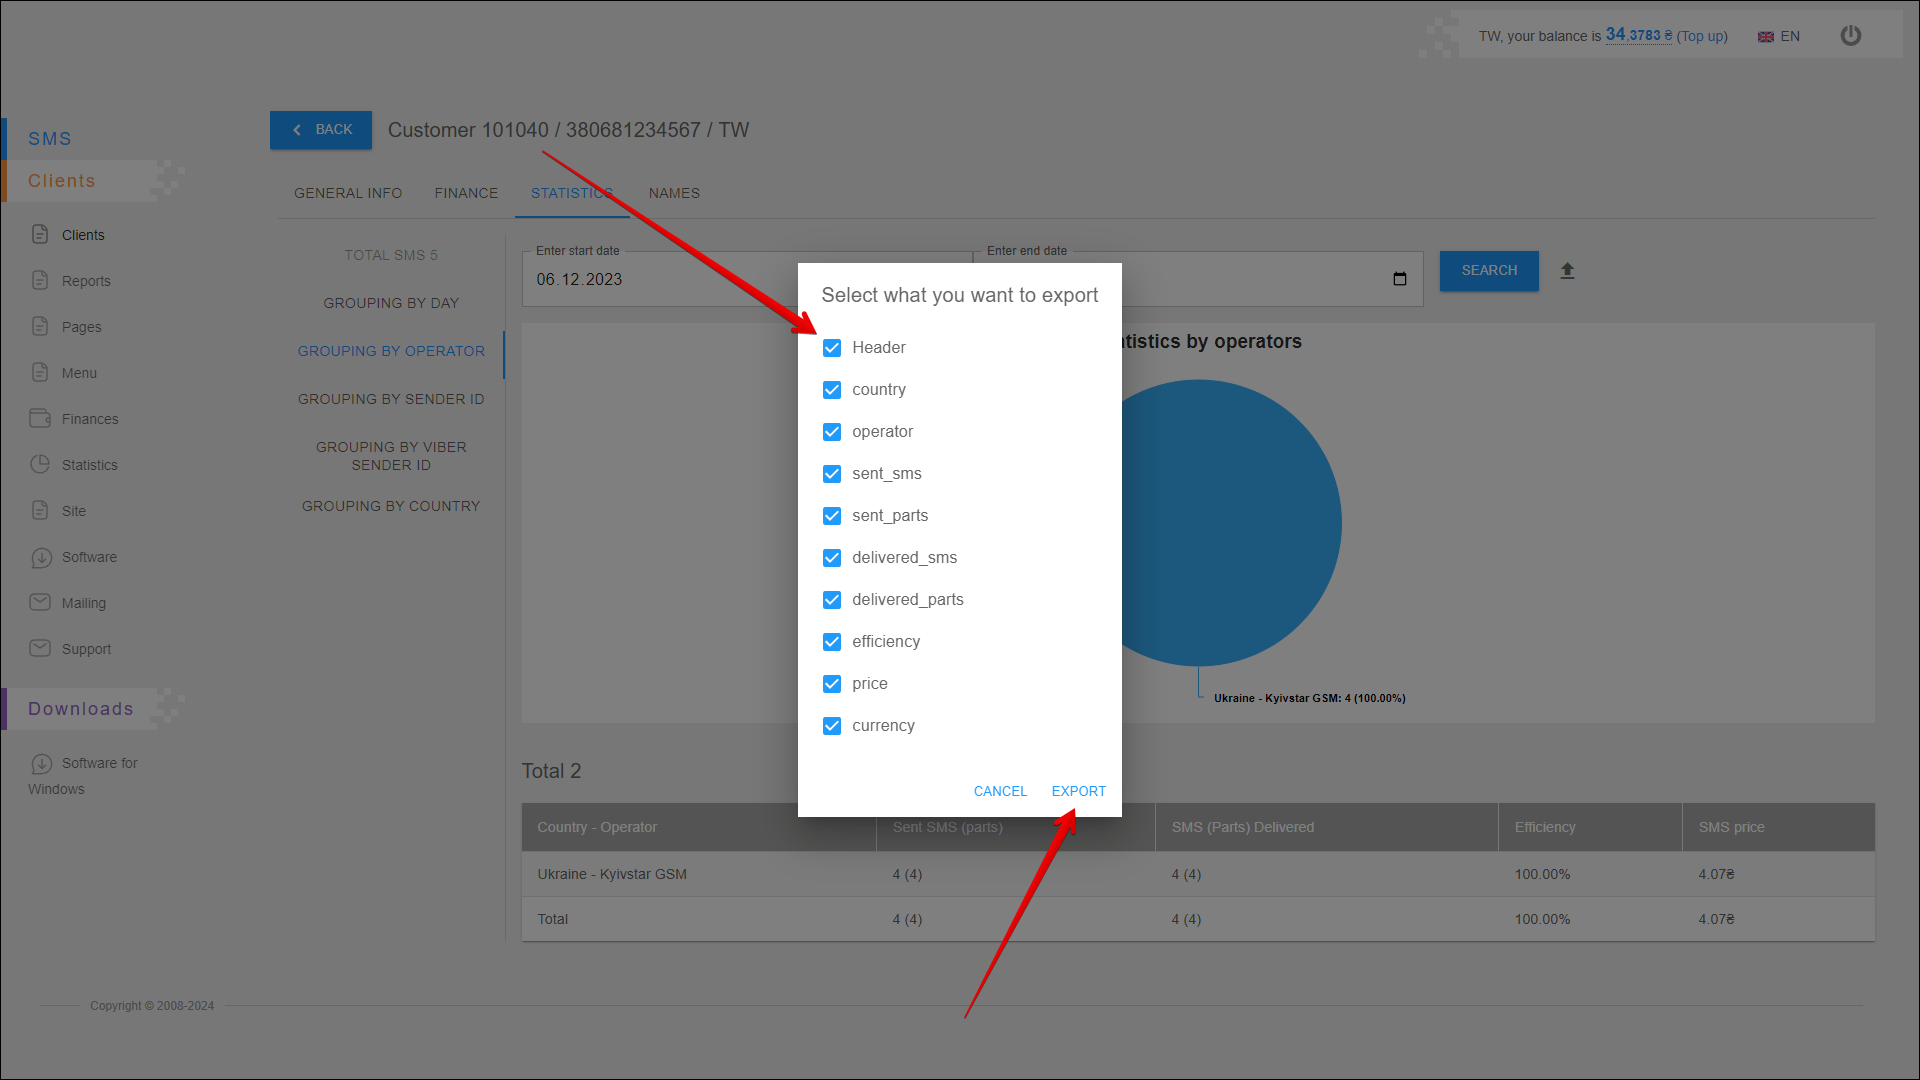
After pressing the EXPORT button, the report will be saved on your device in an .xlsx file.
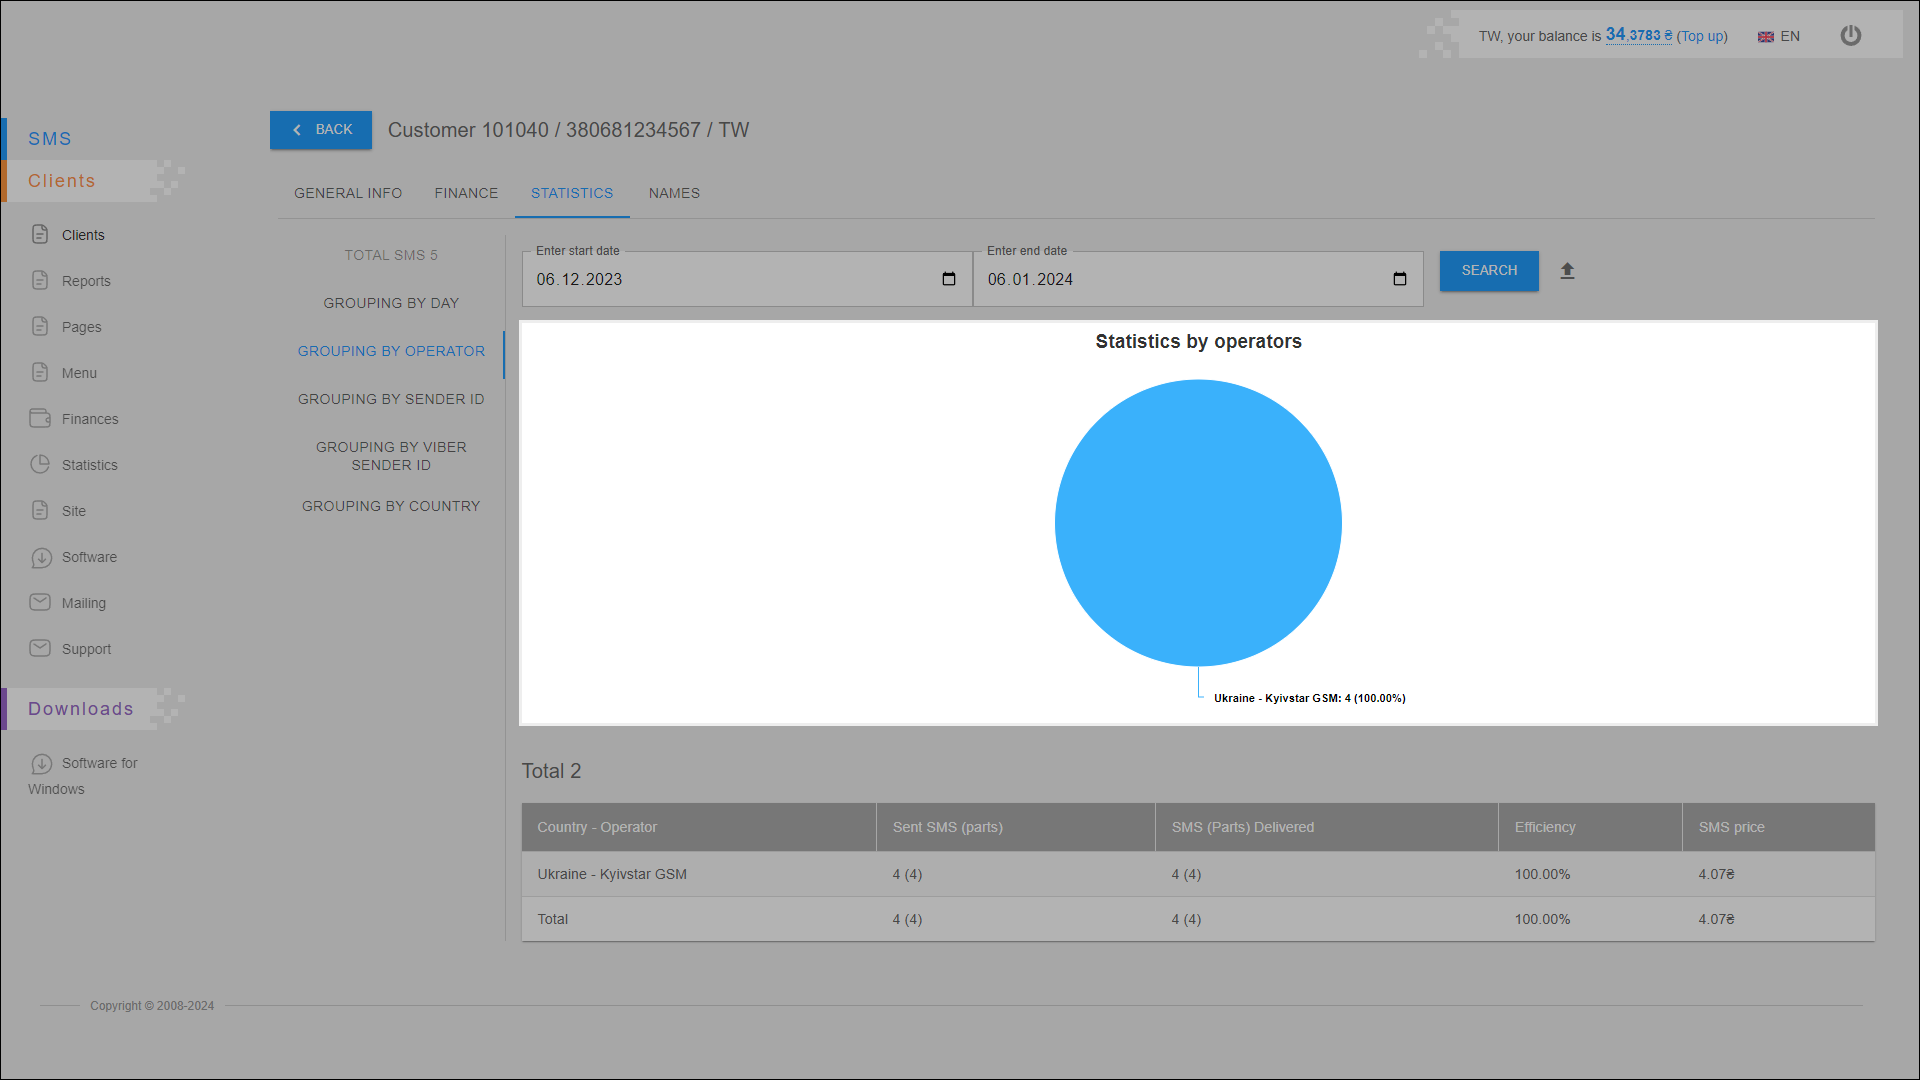
Statistics chart
This chart displays the number of sent messages for each operator. Statistics are displayed for the specified period.
Statistics table
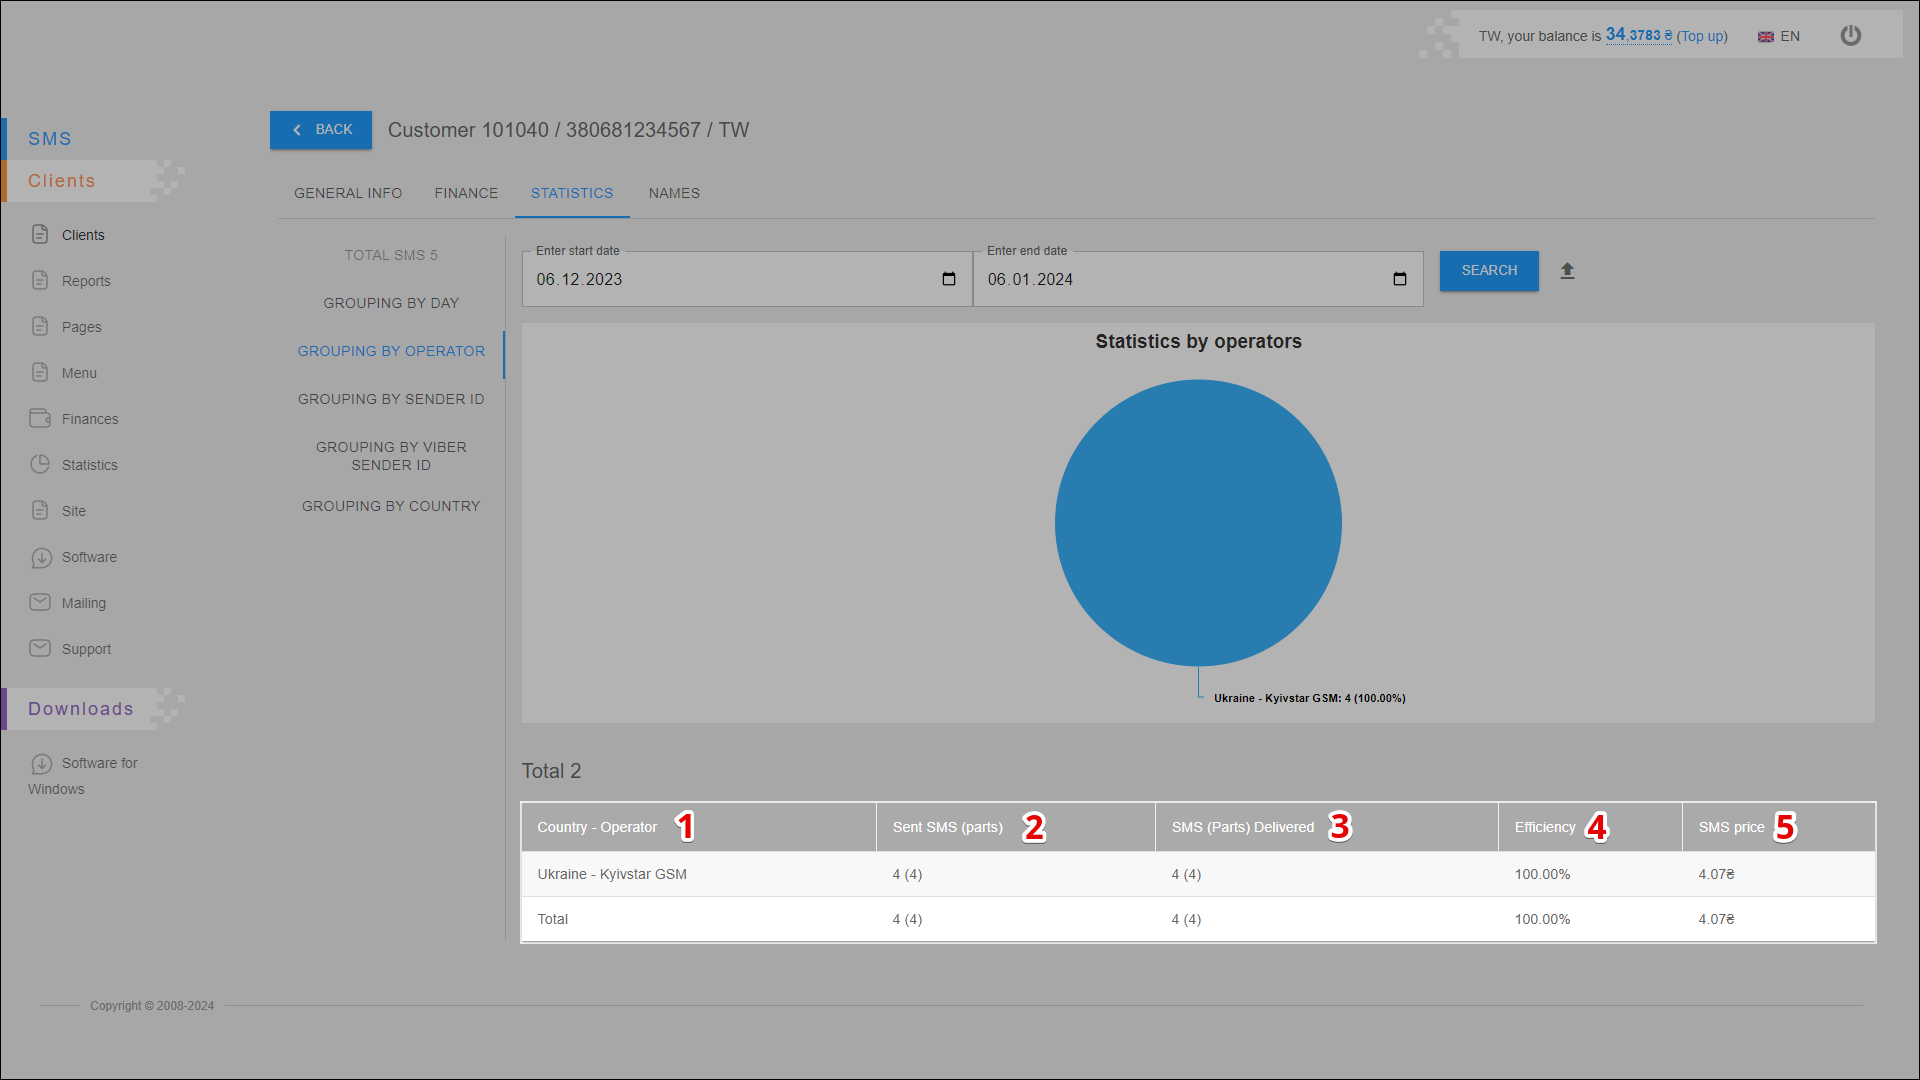
All statistical data are arranged in the table in separate columns:
| № | Column | Description |
|---|---|---|
| 1 | Country - Operator | Country and operator name |
| 2 | Send SMS (parts) | Number of sent messages (parts) |
| 3 | SMS (Parts) Delivered | Number of delivered messages (parts) |
| 4 | Efficiency | Mailing efficiency (number of delivered messages out of the total number of sent messages ) |
| 5 | SMS Price | Messaging costs |
GROUPING BY SENDER ID
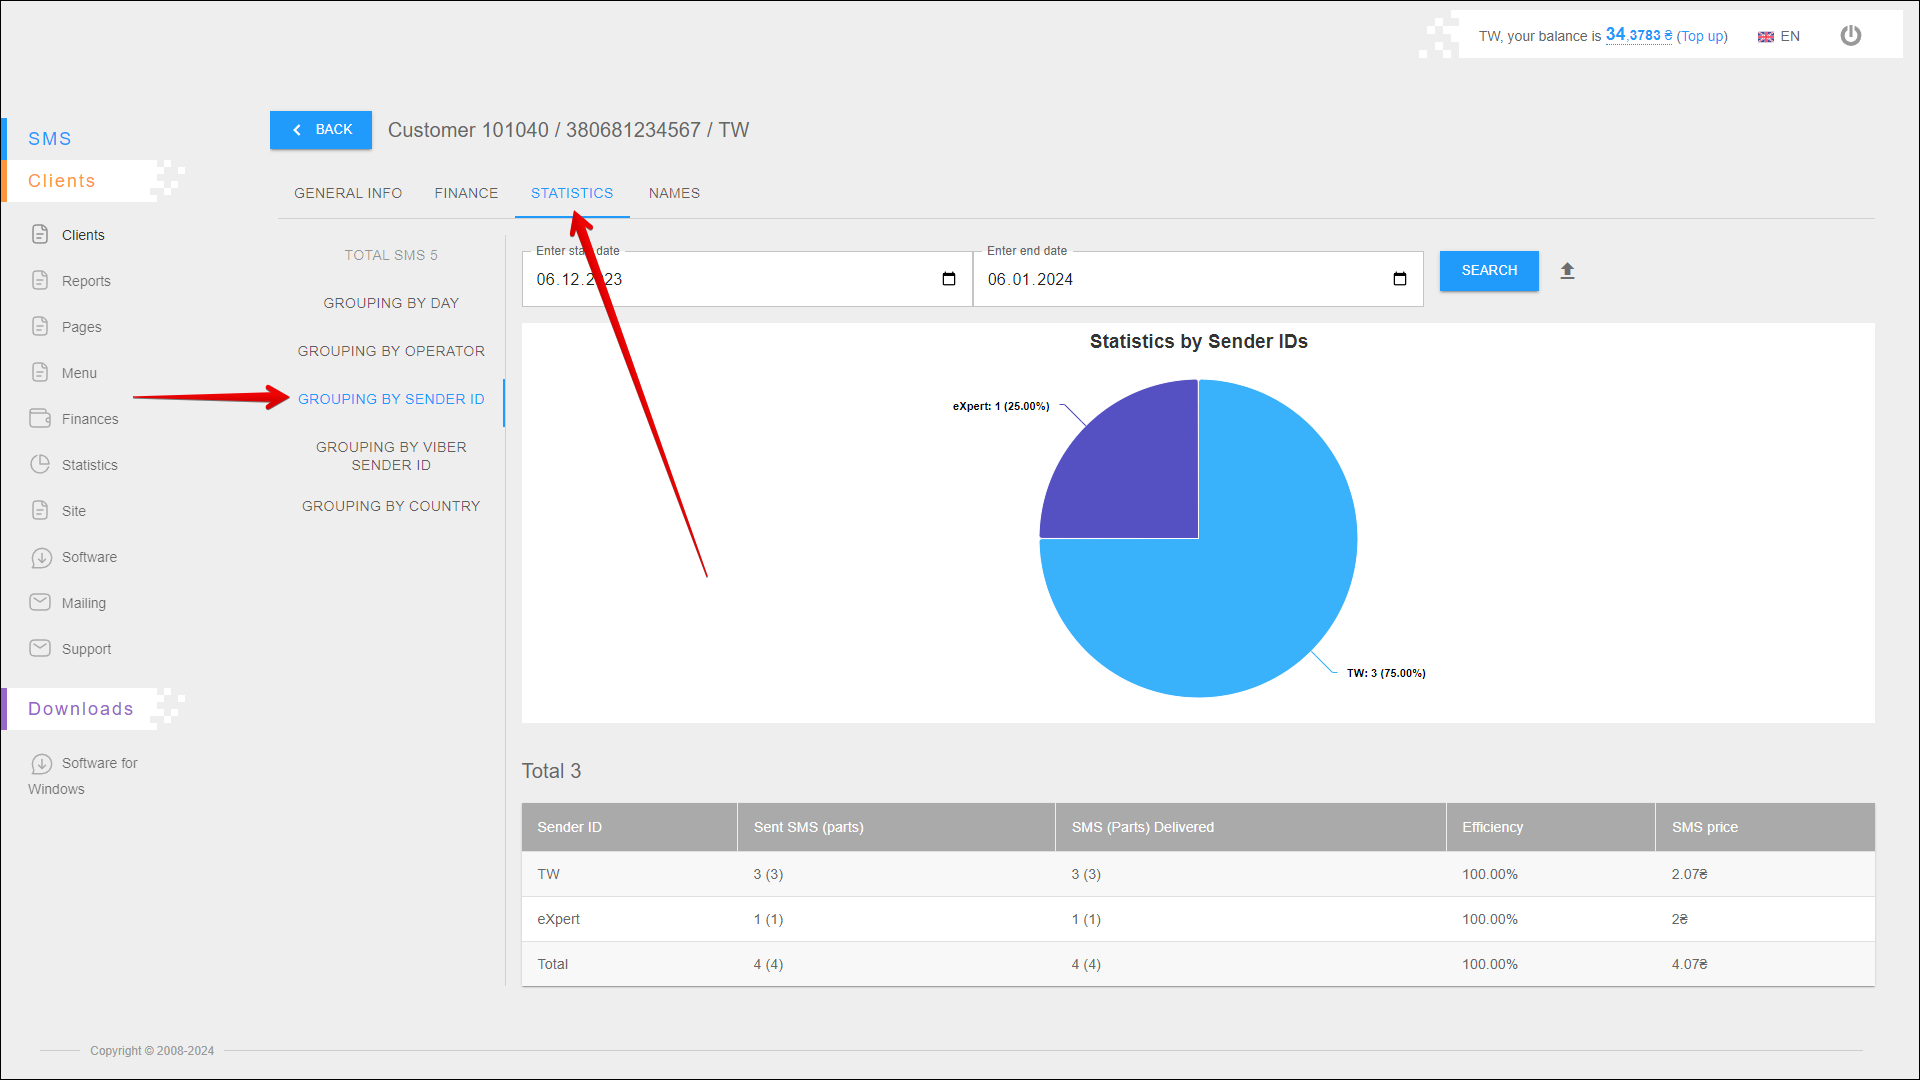
In this report you can view statistics by sender id and also check the efficiency of the mailing.
To open this report, open the STATISTICS tab and select the GROUPING BY SENDER ID report.
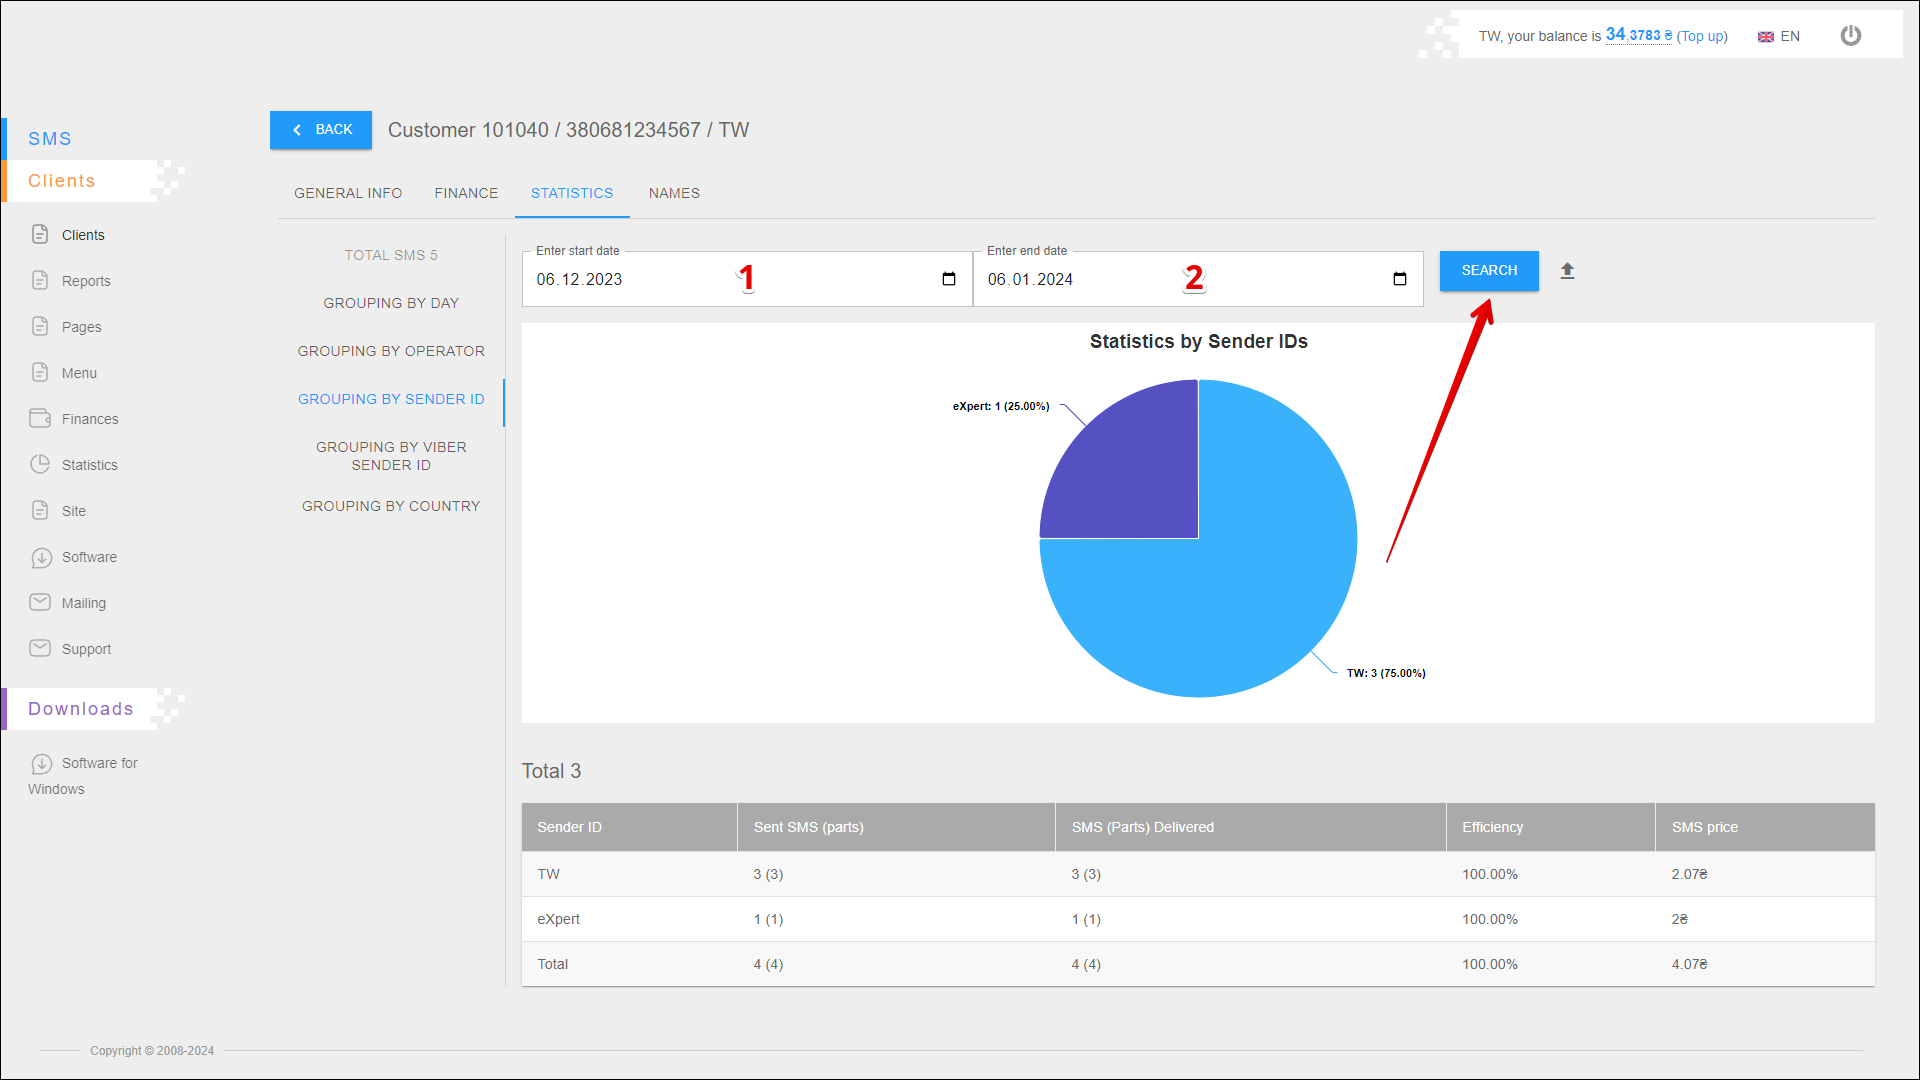
Period selection
To select the time period for which you want to display statistic, follow the steps below:
| № | Action |
|---|---|
| 1 | Enter the start date. You can enter the date manually or select it in the calendar, to do this, click the Calendar icon on the right side of the field |
| 2 | Enter the end date. You can enter the date manually or select it in the calendar, to do this, click the Calendar icon on the right side of the field |
After selecting a date, click the SEARCH button. The page will be refreshed and display statistics for the specified period.
Exporting a report
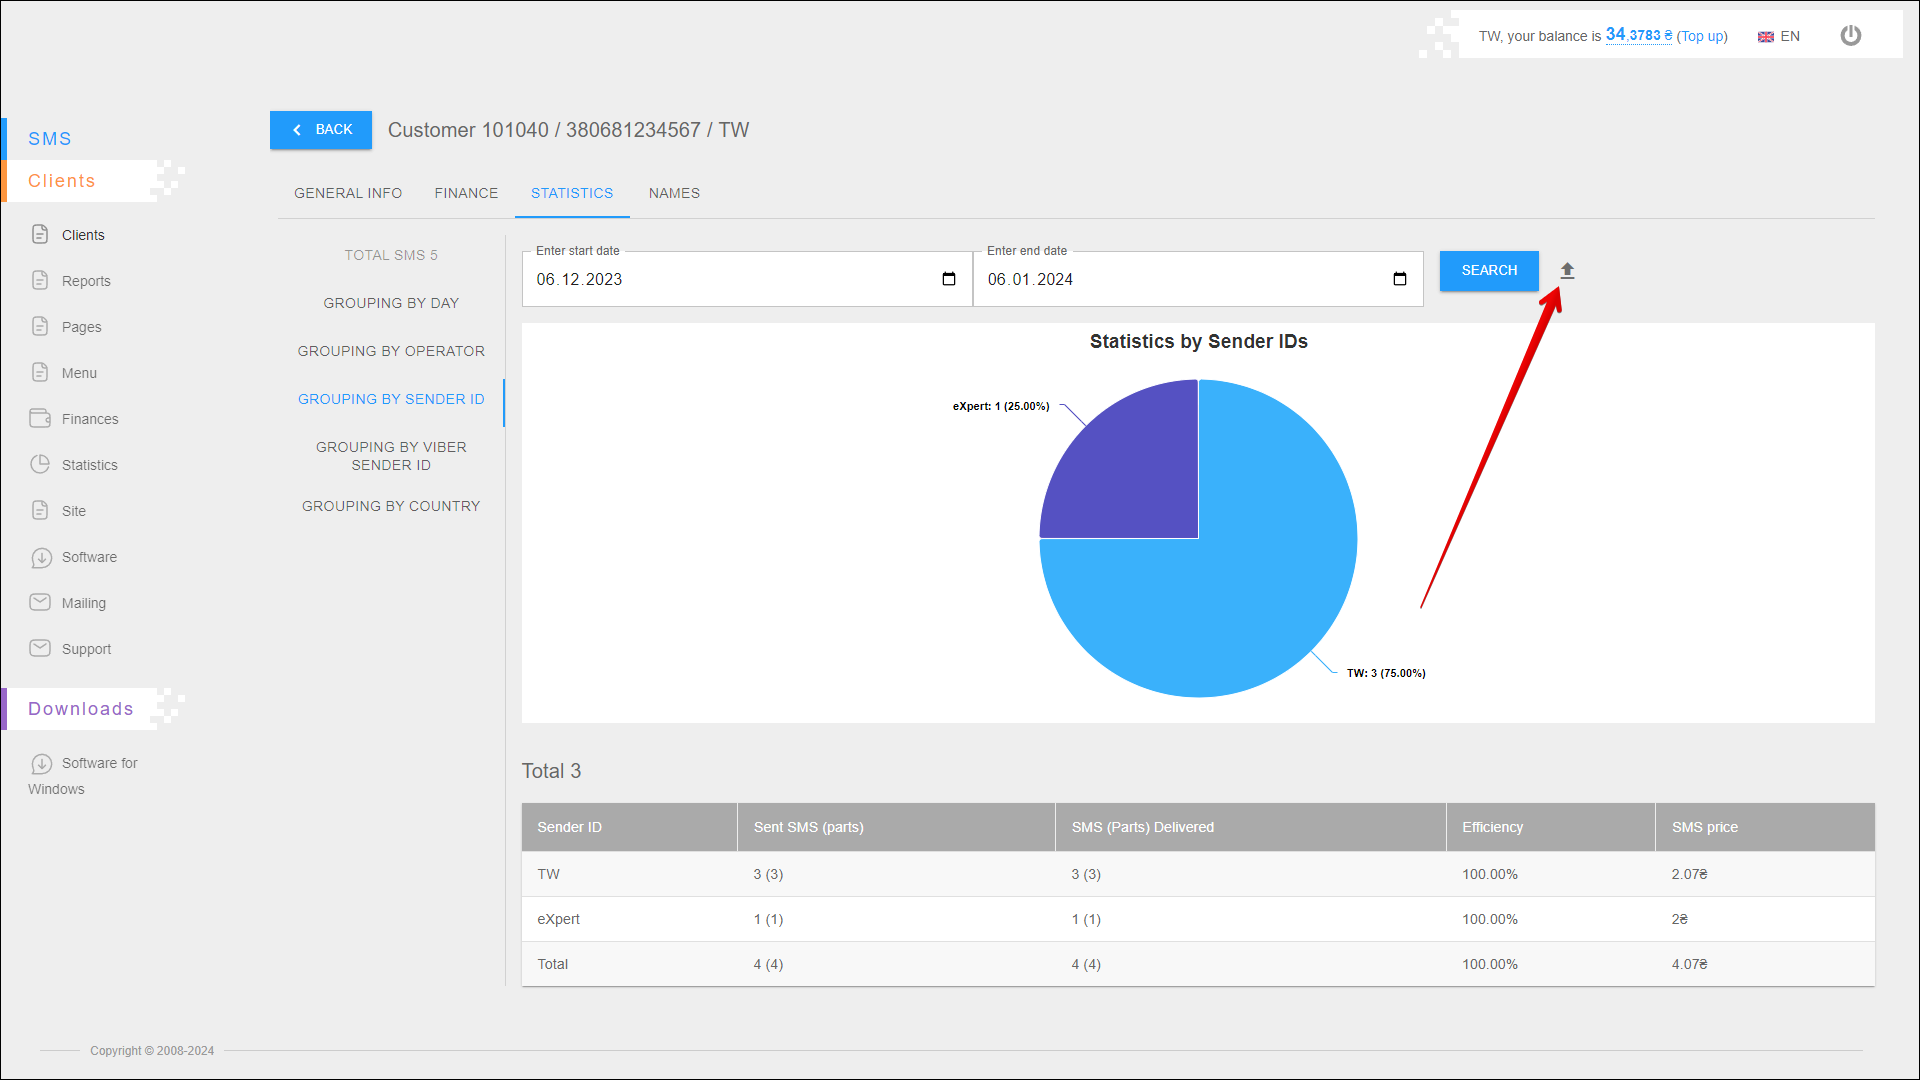
To export statistical reporting click the Export button icon to the right of the SEARCH button.
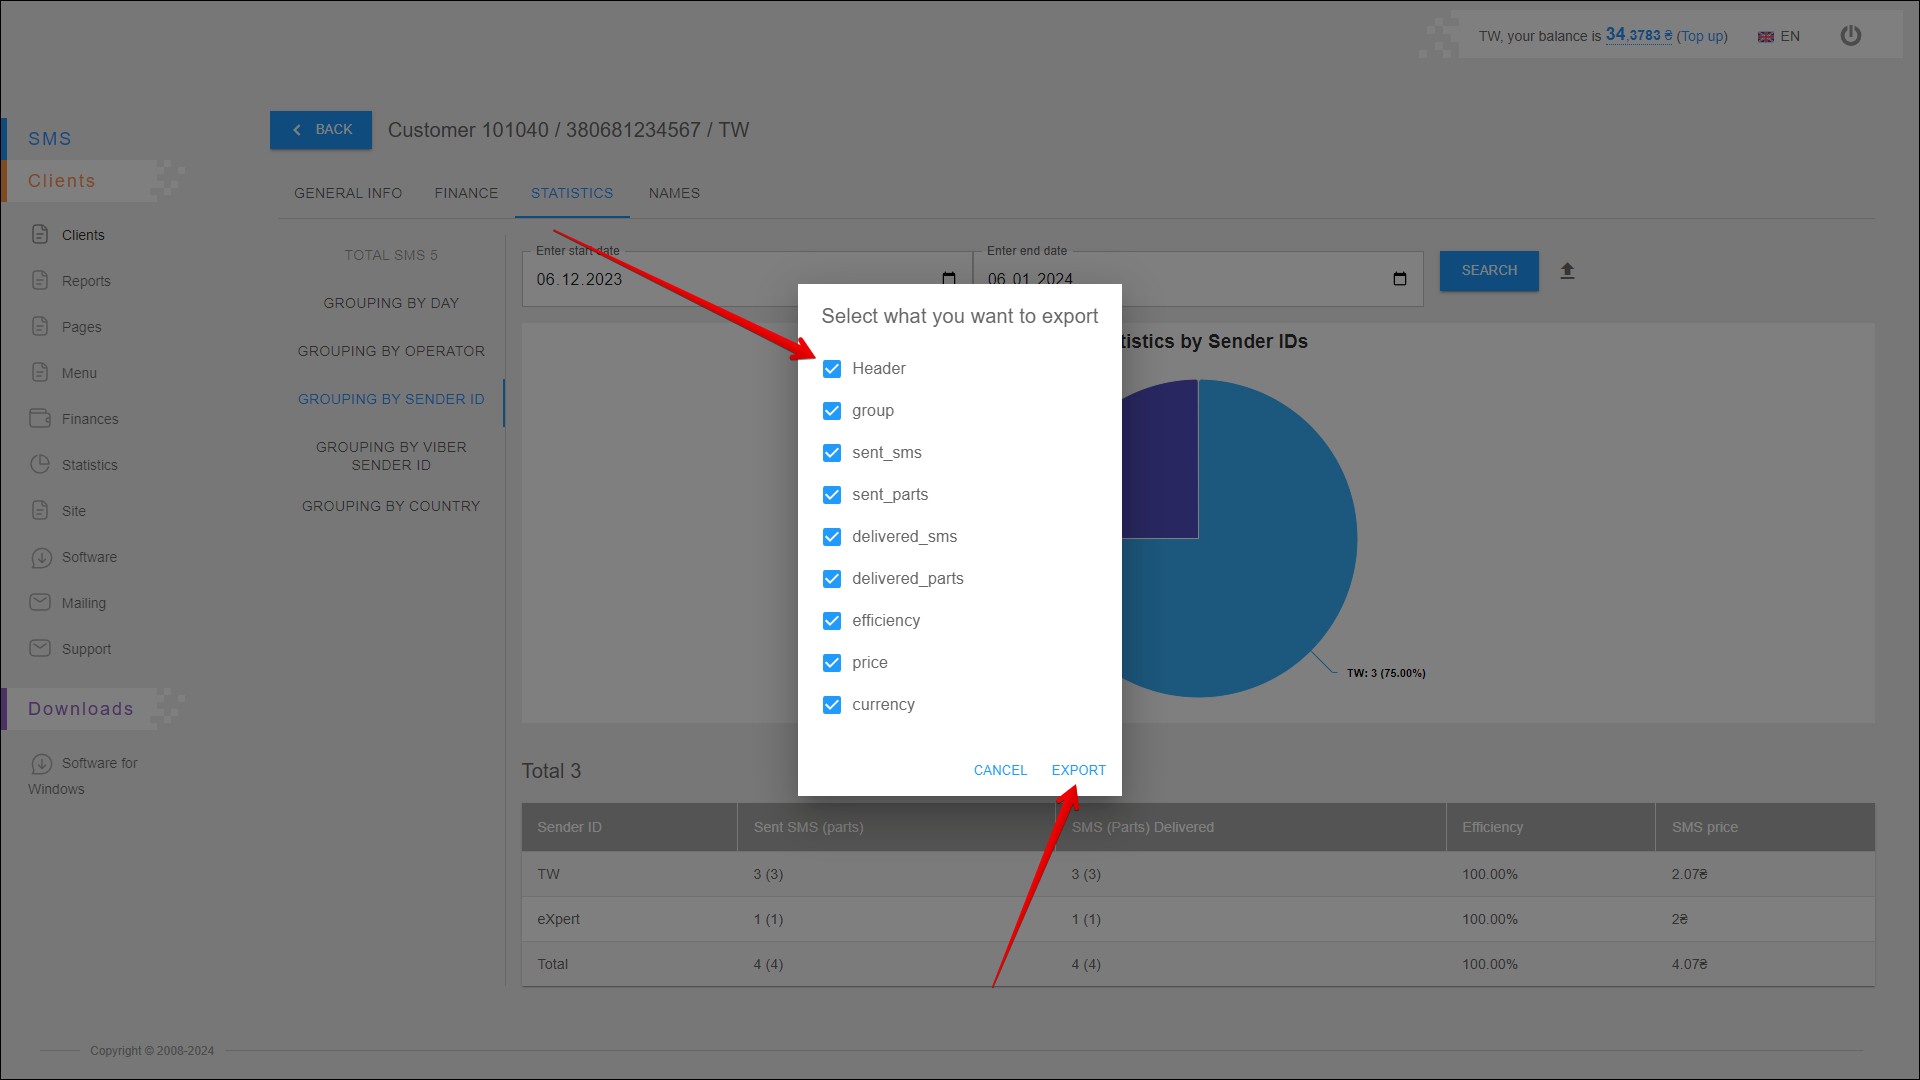
A new pop-up window will open where you need to select the data you want to export. After selecting the data, click the EXPORT button to export. To cancel, click the CANCEL button.
After pressing the EXPORT button, the report will be saved on your device in an .xlsx file.
Statistics chart
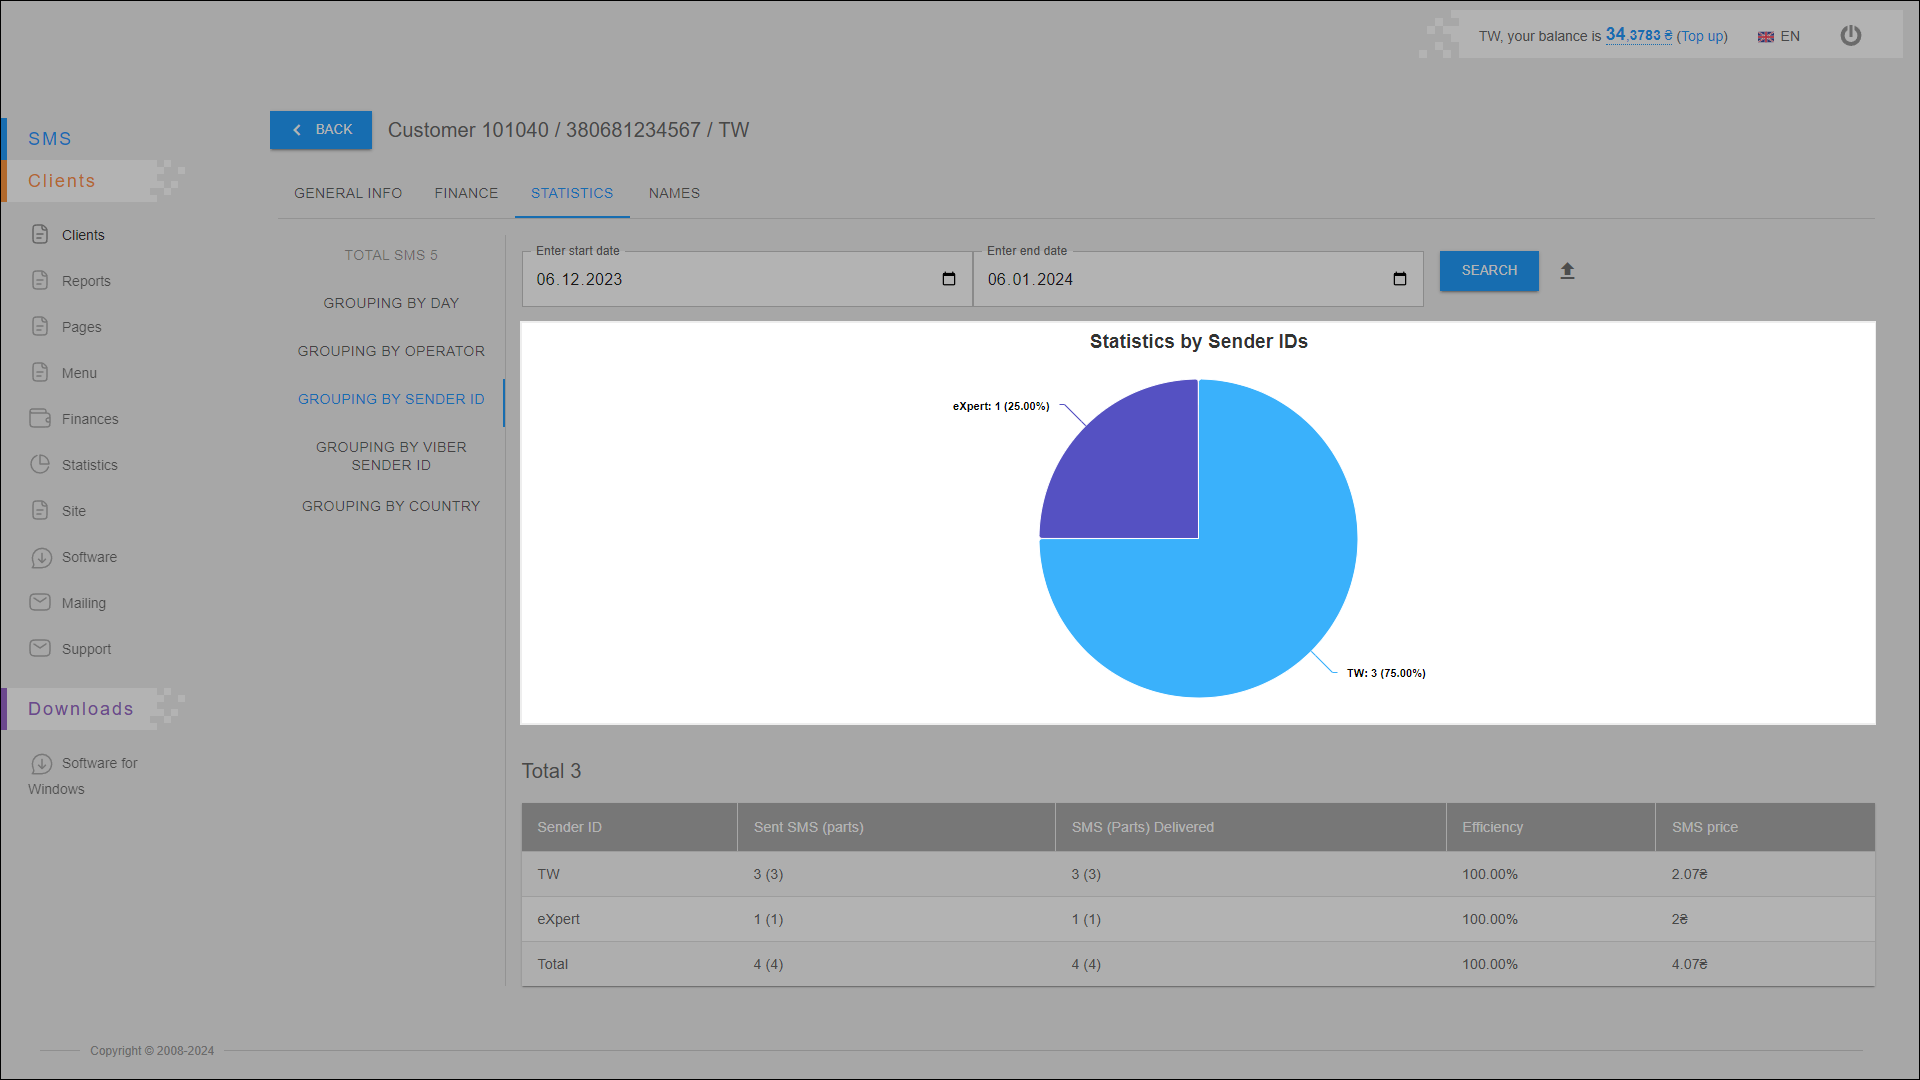
This chart displays the number of sent messages for each sender ID. Statistics are displayed for the specified period.
Statistics table
All statistical data are arranged in the table in separate columns:
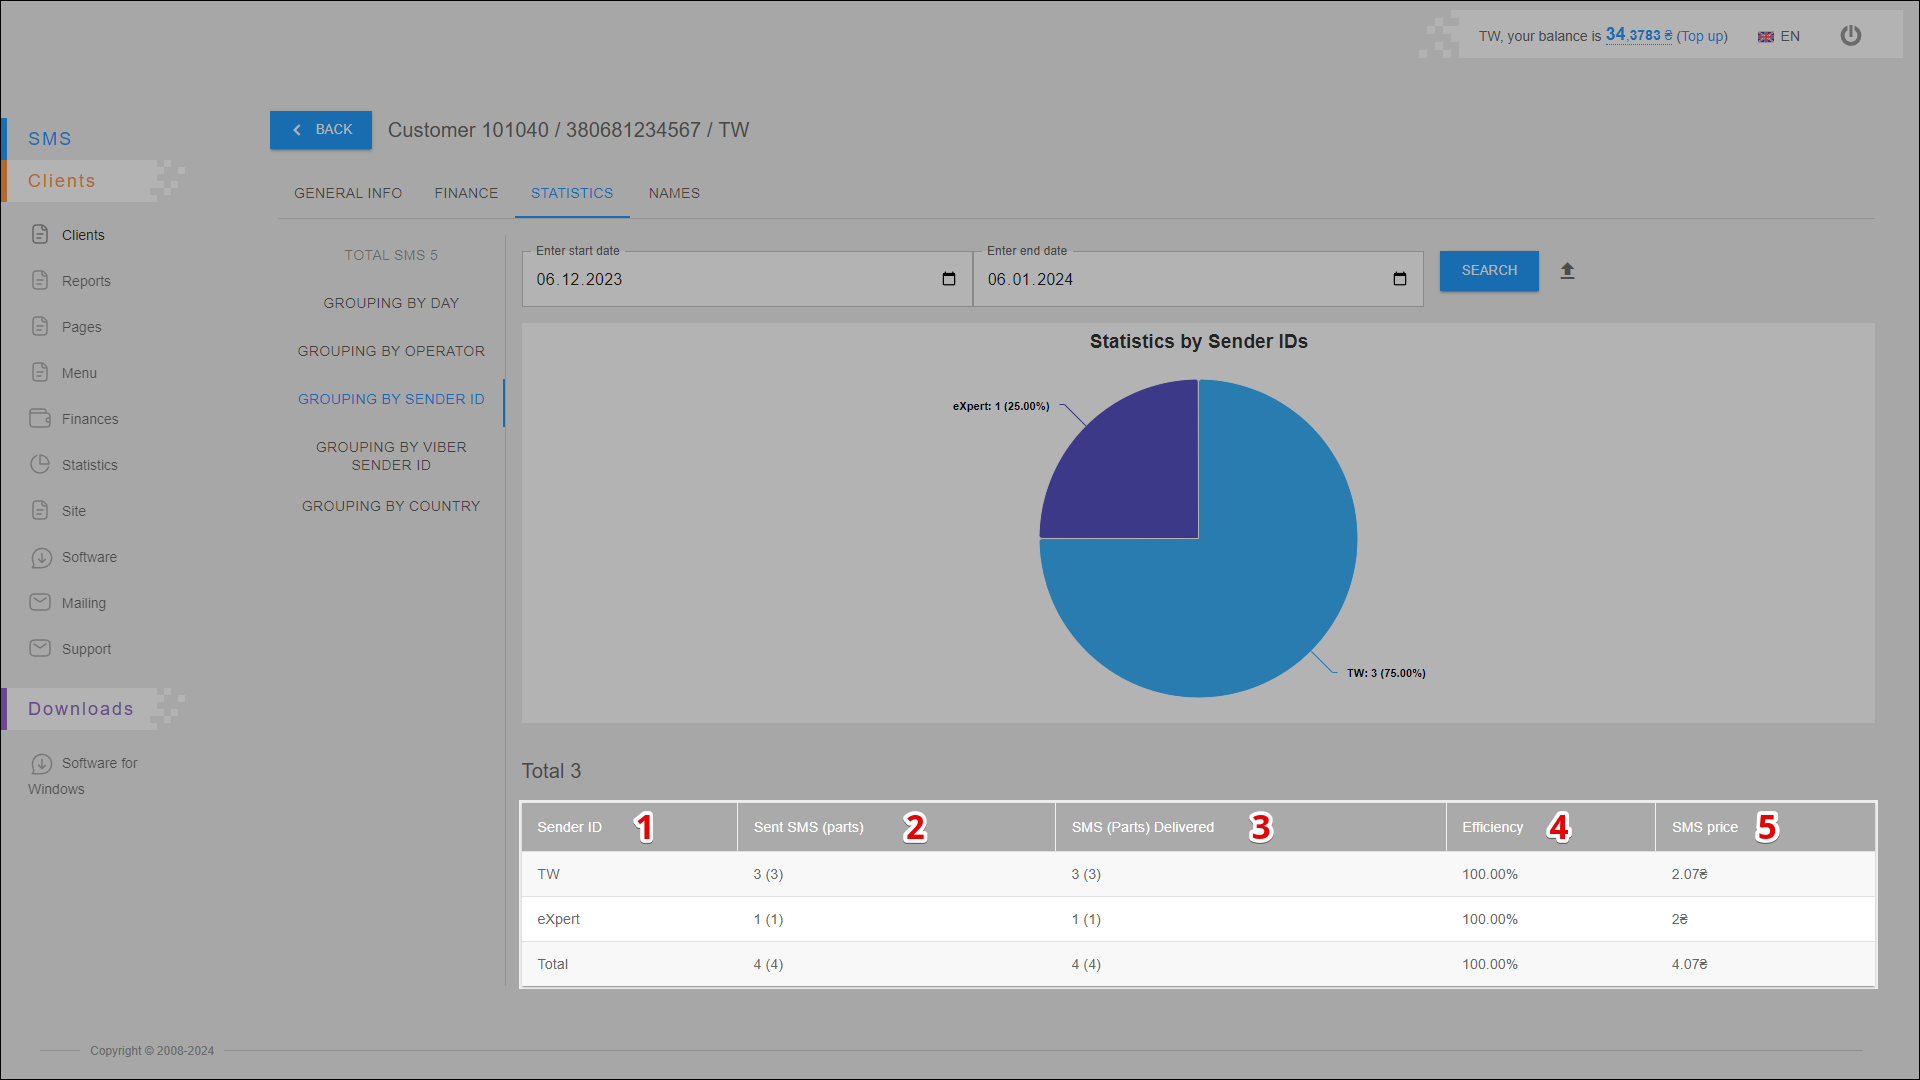
| № | Column | Description |
|---|---|---|
| 1 | Sender ID | Sender's name (ID) |
| 2 | Send SMS (parts) | Number of sent messages (parts) |
| 3 | SMS (Parts) Delivered | Number of delivered messages (parts) |
| 4 | Efficiency | Mailing efficiency (number of delivered messages out of the total number of sent messages ) |
| 5 | SMS Price | Messaging costs |
GROUPING BY VIBER SENDER ID
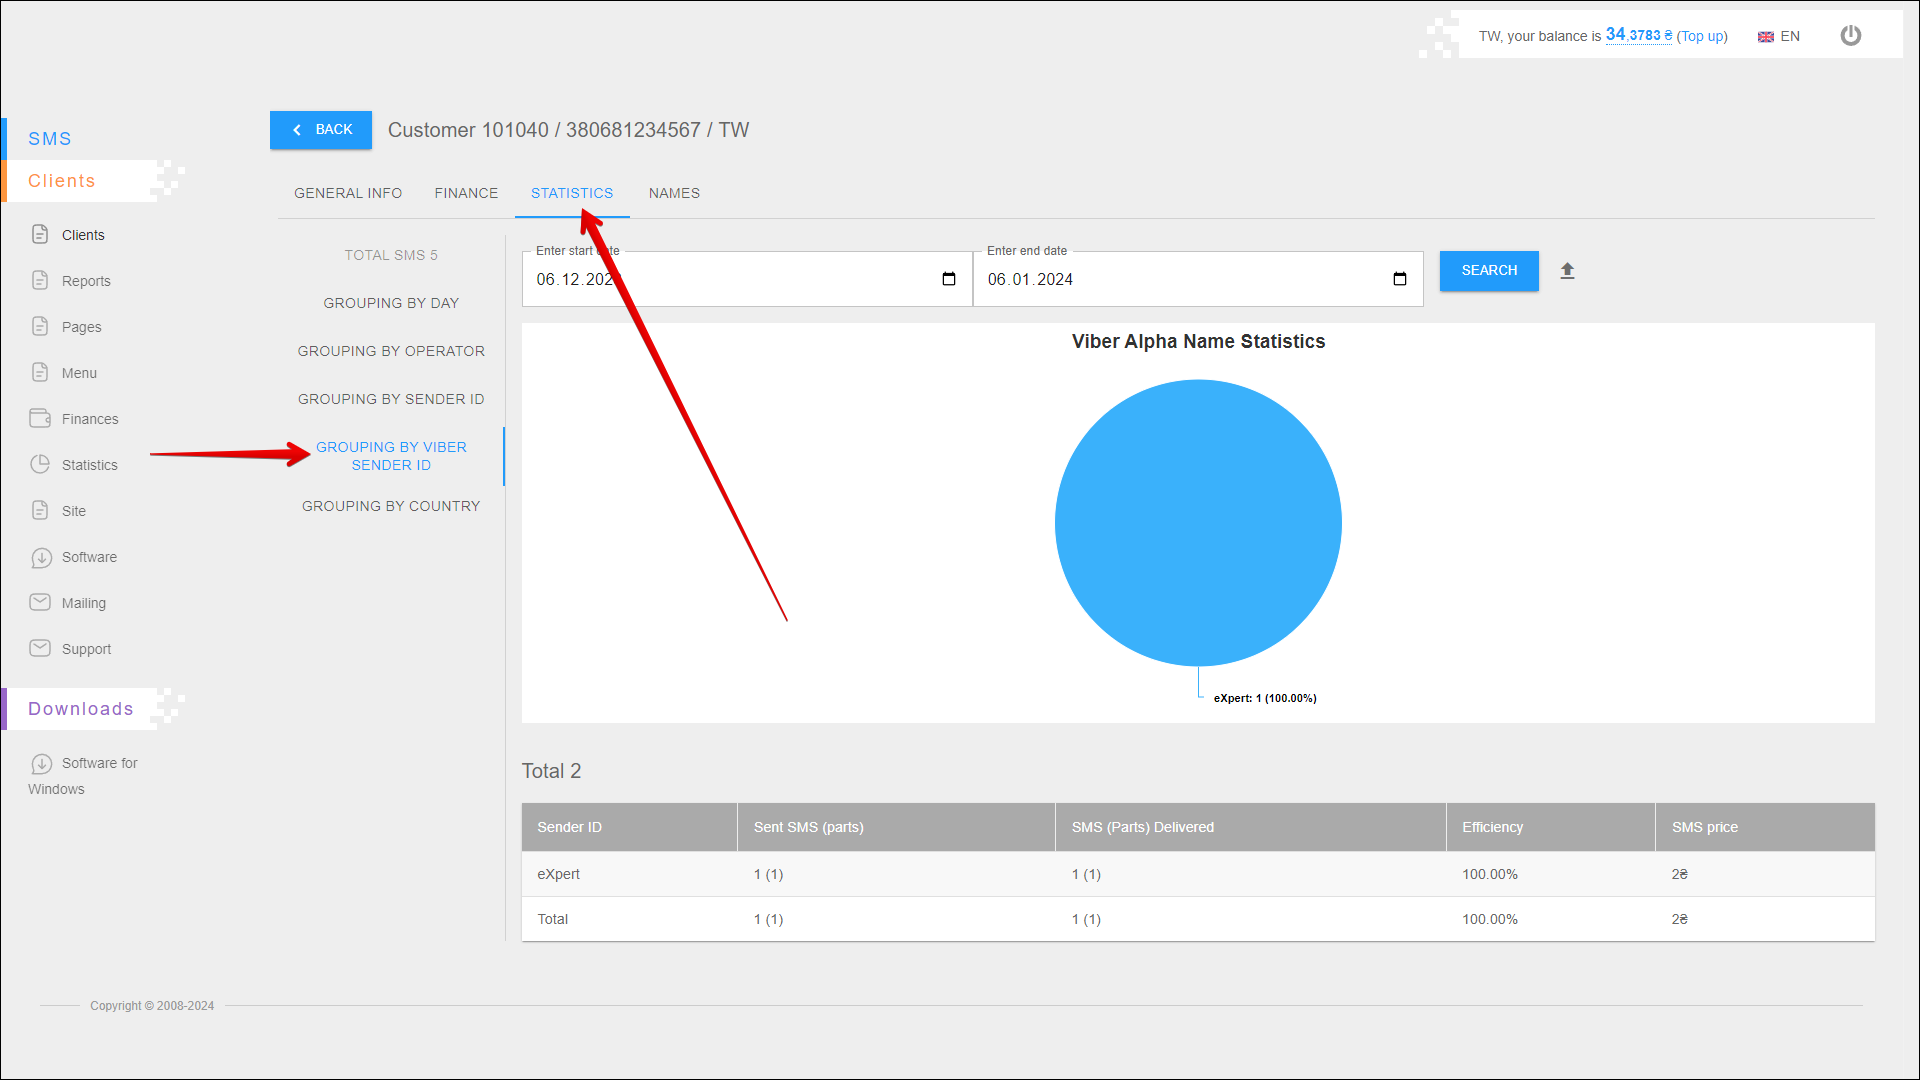
In this report you can view statistics by viber sender id and also check the efficiency of the mailing.
To open this report, open the STATISTICS tab and select the GROUPING BY VIBER SENDER ID report.
Period selection
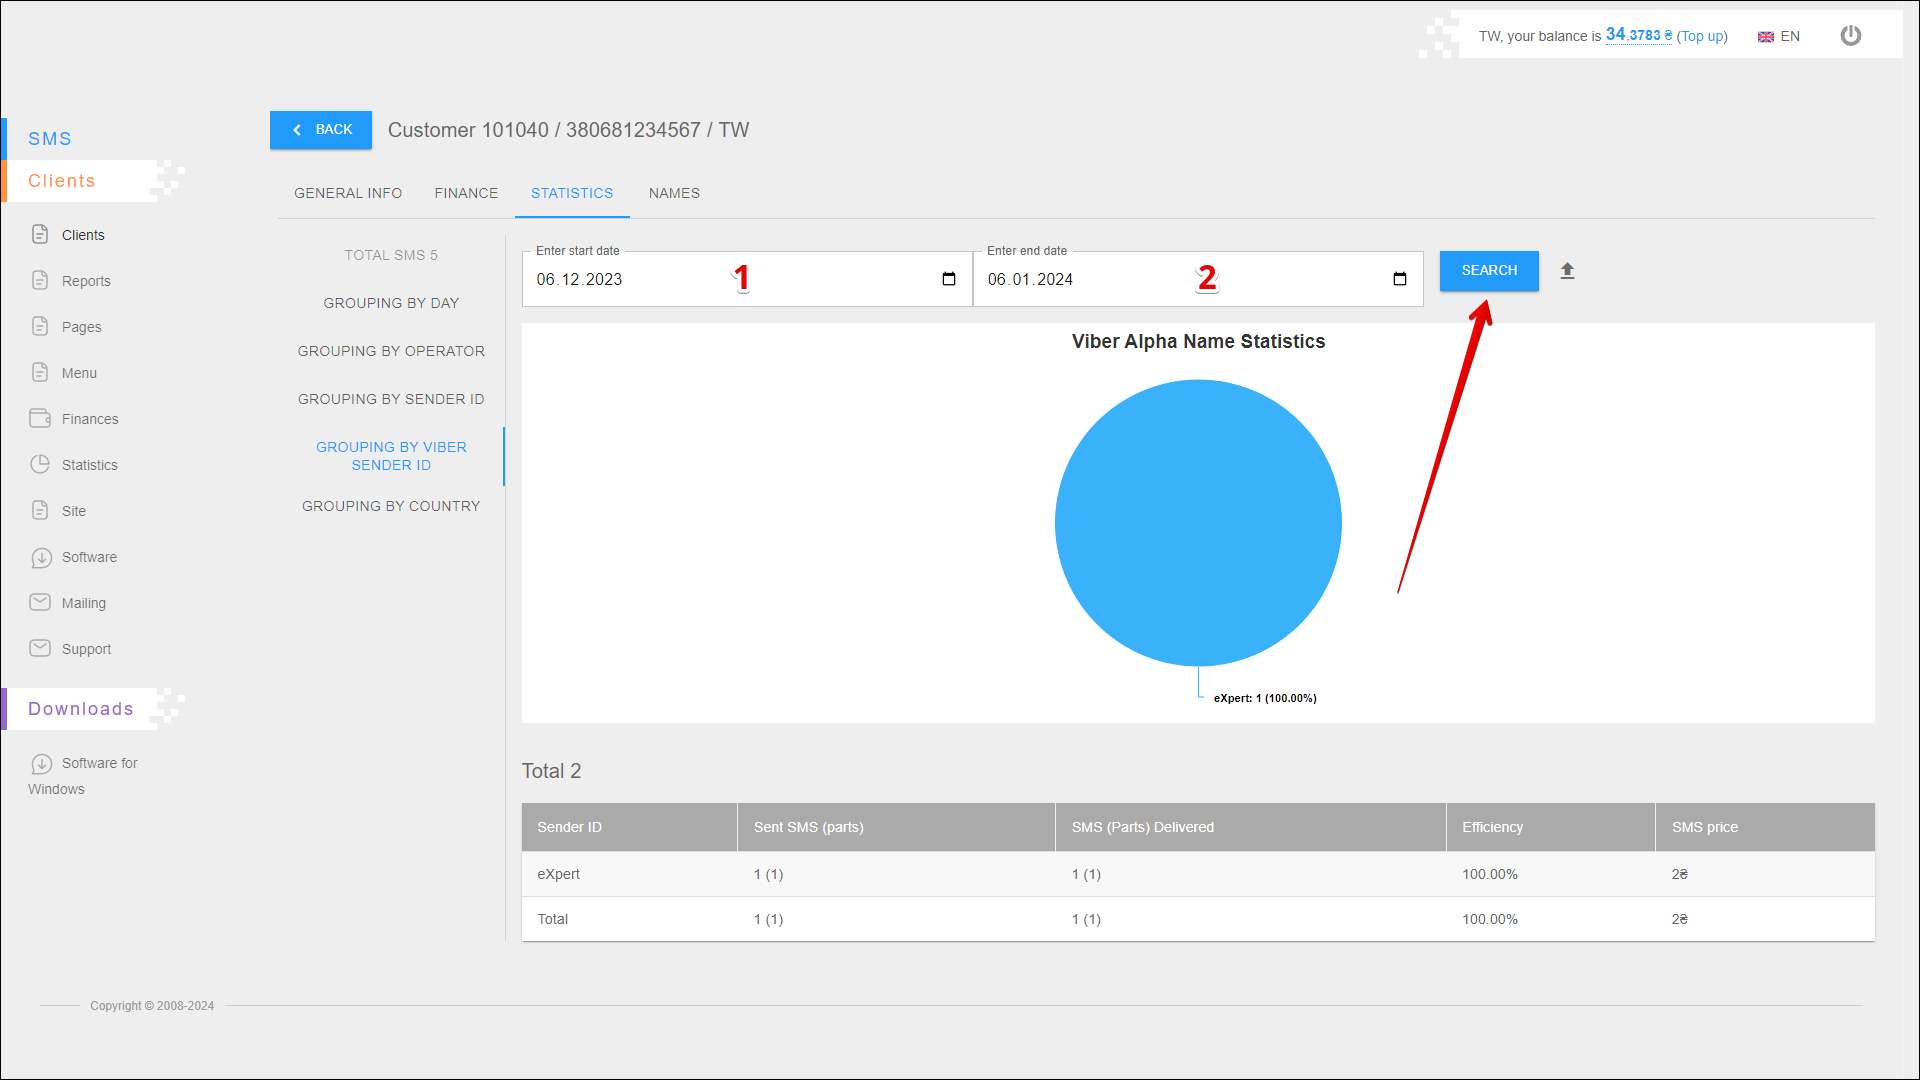
To select the time period for which you want to display statistic, follow the steps below:
| № | Action |
|---|---|
| 1 | Enter the start date. You can enter the date manually or select it in the calendar, to do this, click the Calendar icon on the right side of the field |
| 2 | Enter the end date. You can enter the date manually or select it in the calendar, to do this, click the Calendar icon on the right side of the field |
After selecting a date, click the SEARCH button. The page will be refreshed and display statistics for the specified period.
Exporting a report
To export statistical reporting click the Export button icon to the right of the SEARCH button.
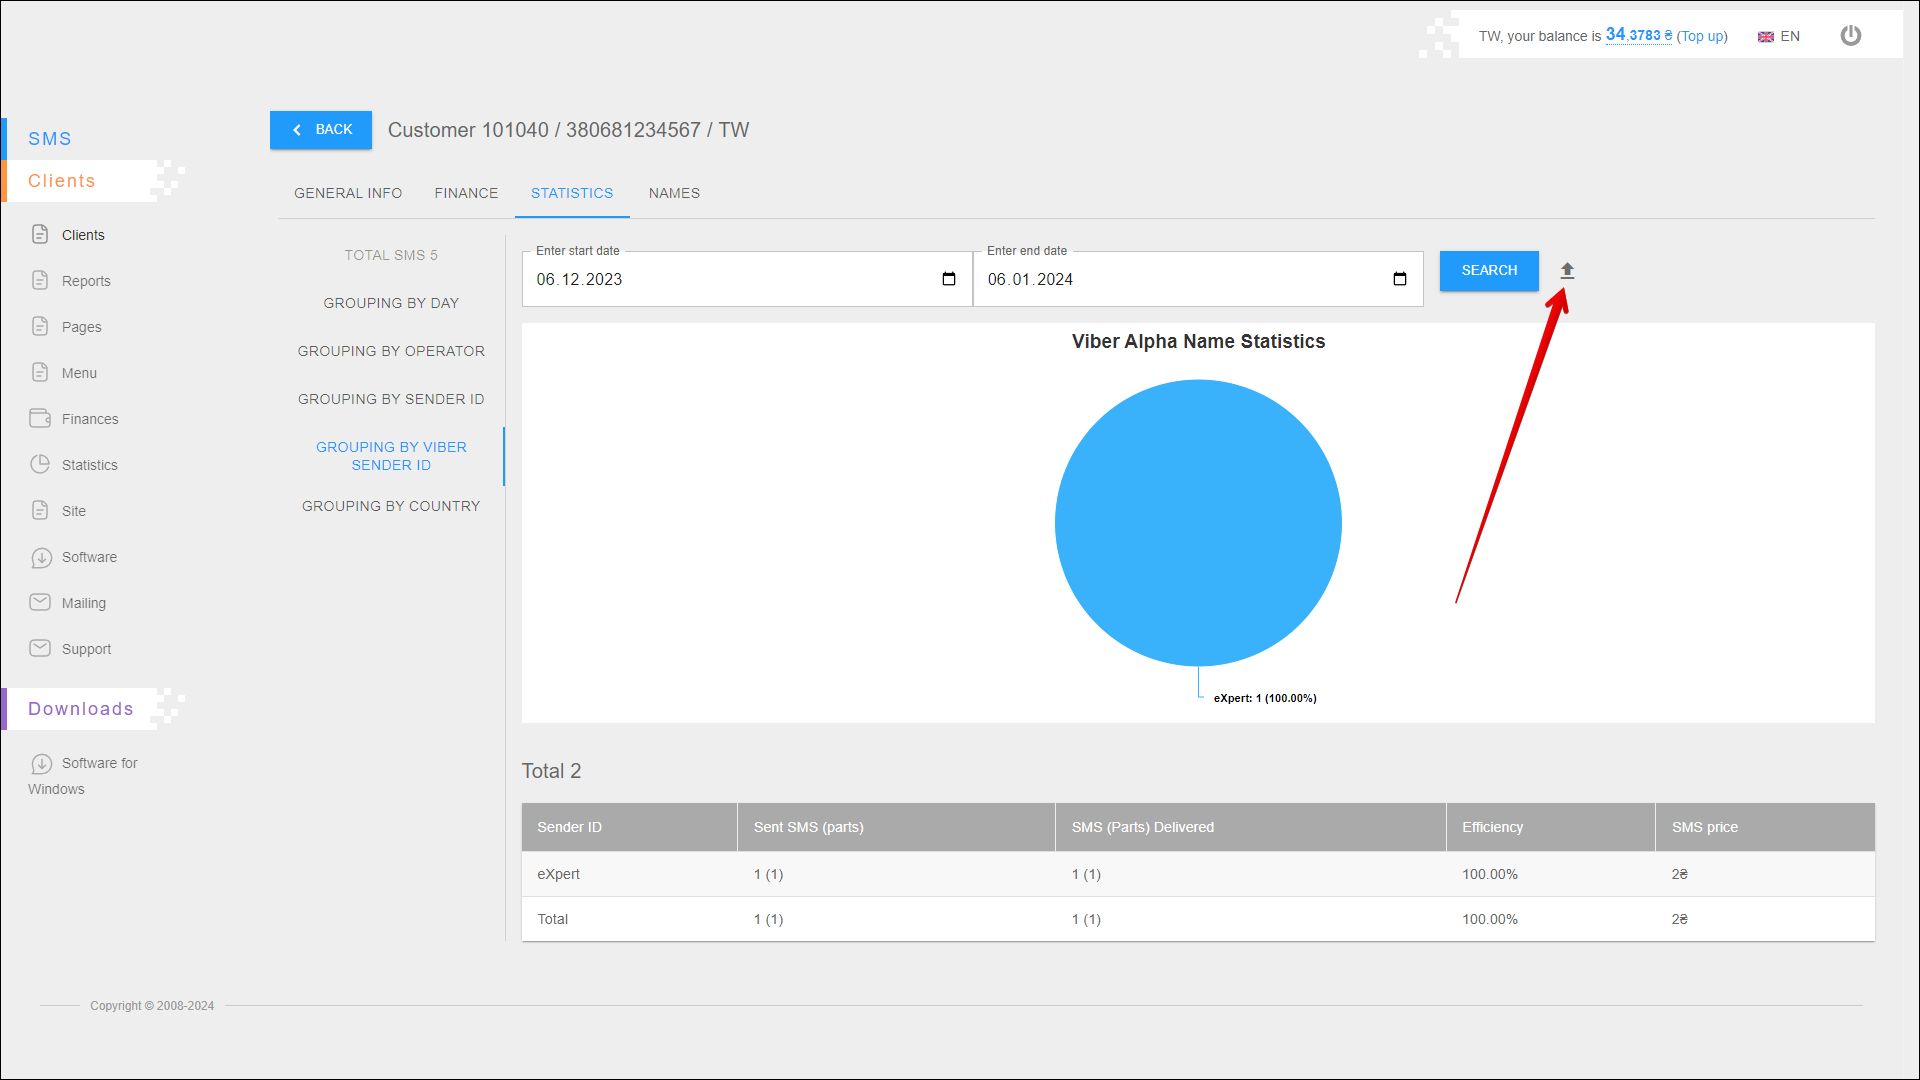
A new pop-up window will open where you need to select the data you want to export. After selecting the data, click the EXPORT button to export. To cancel, click the CANCEL button.
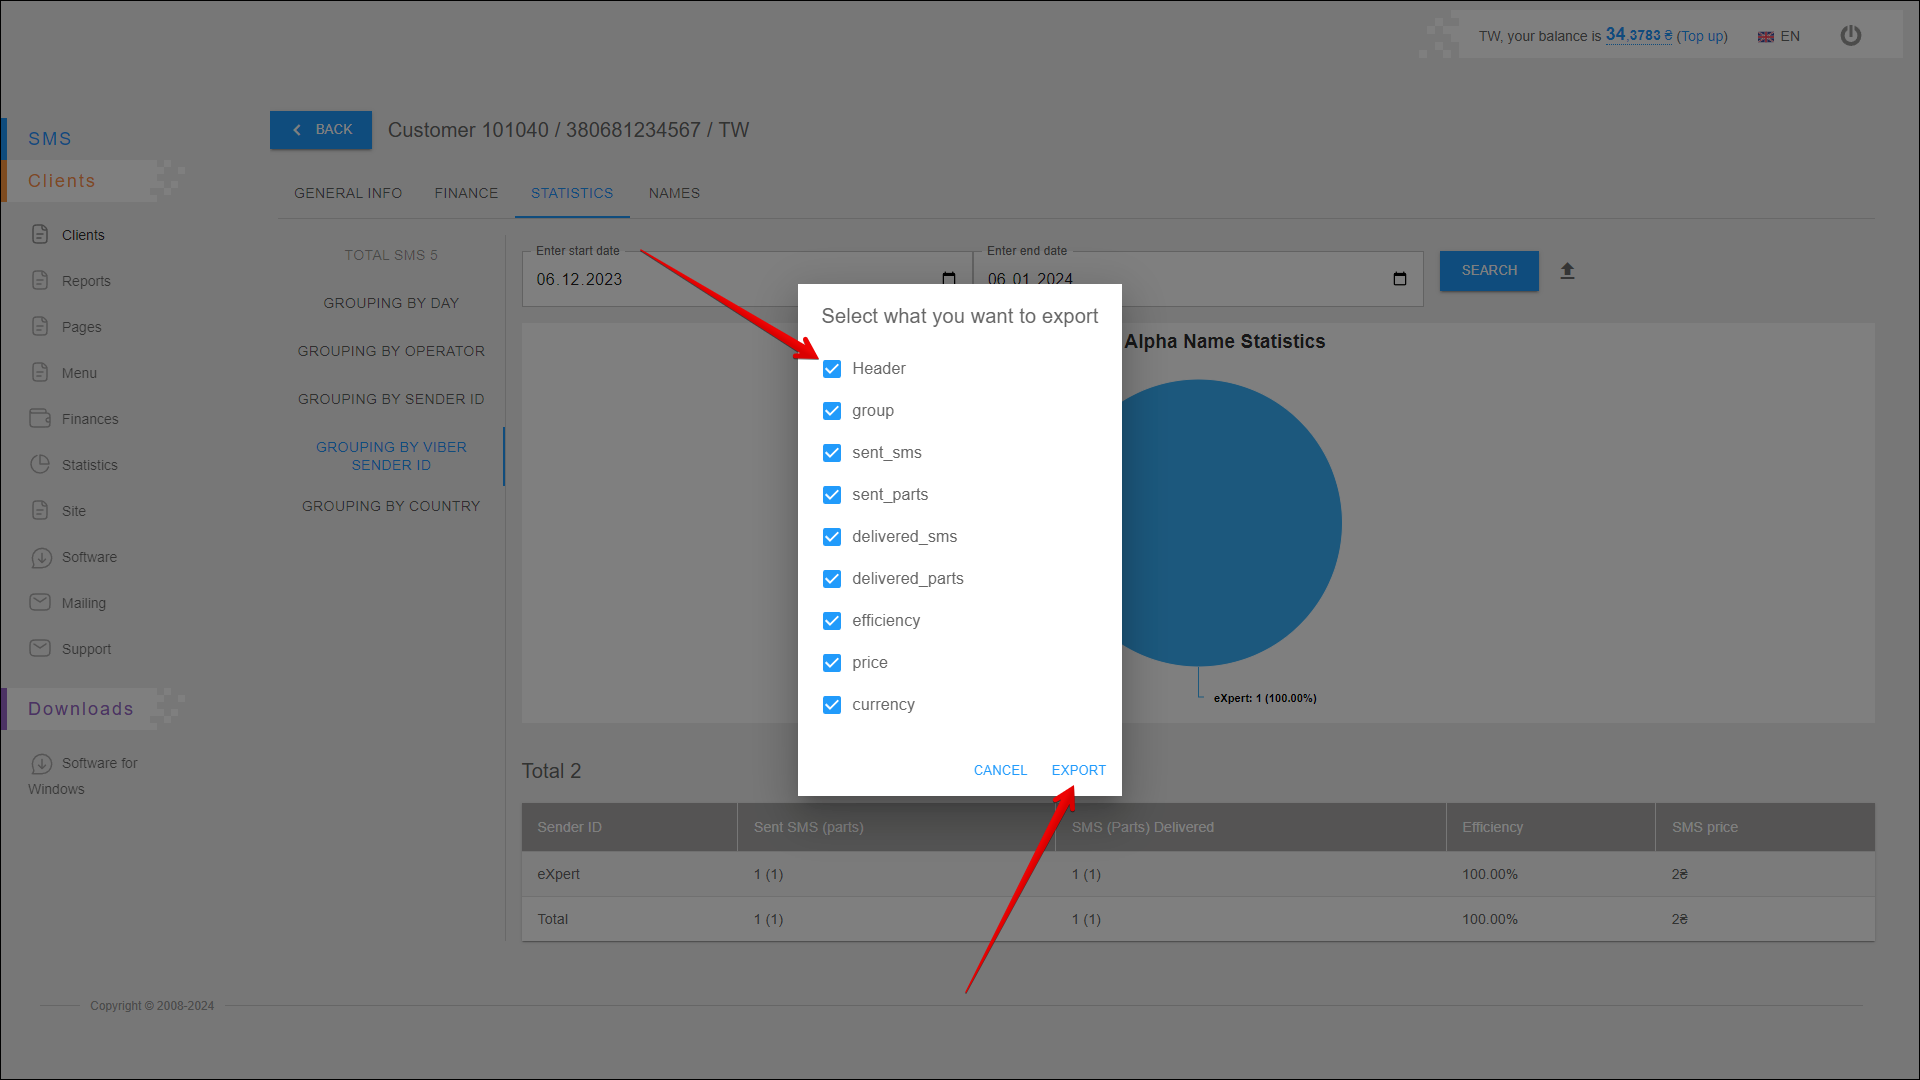
After pressing the EXPORT button, the report will be saved on your device in an .xlsx file.
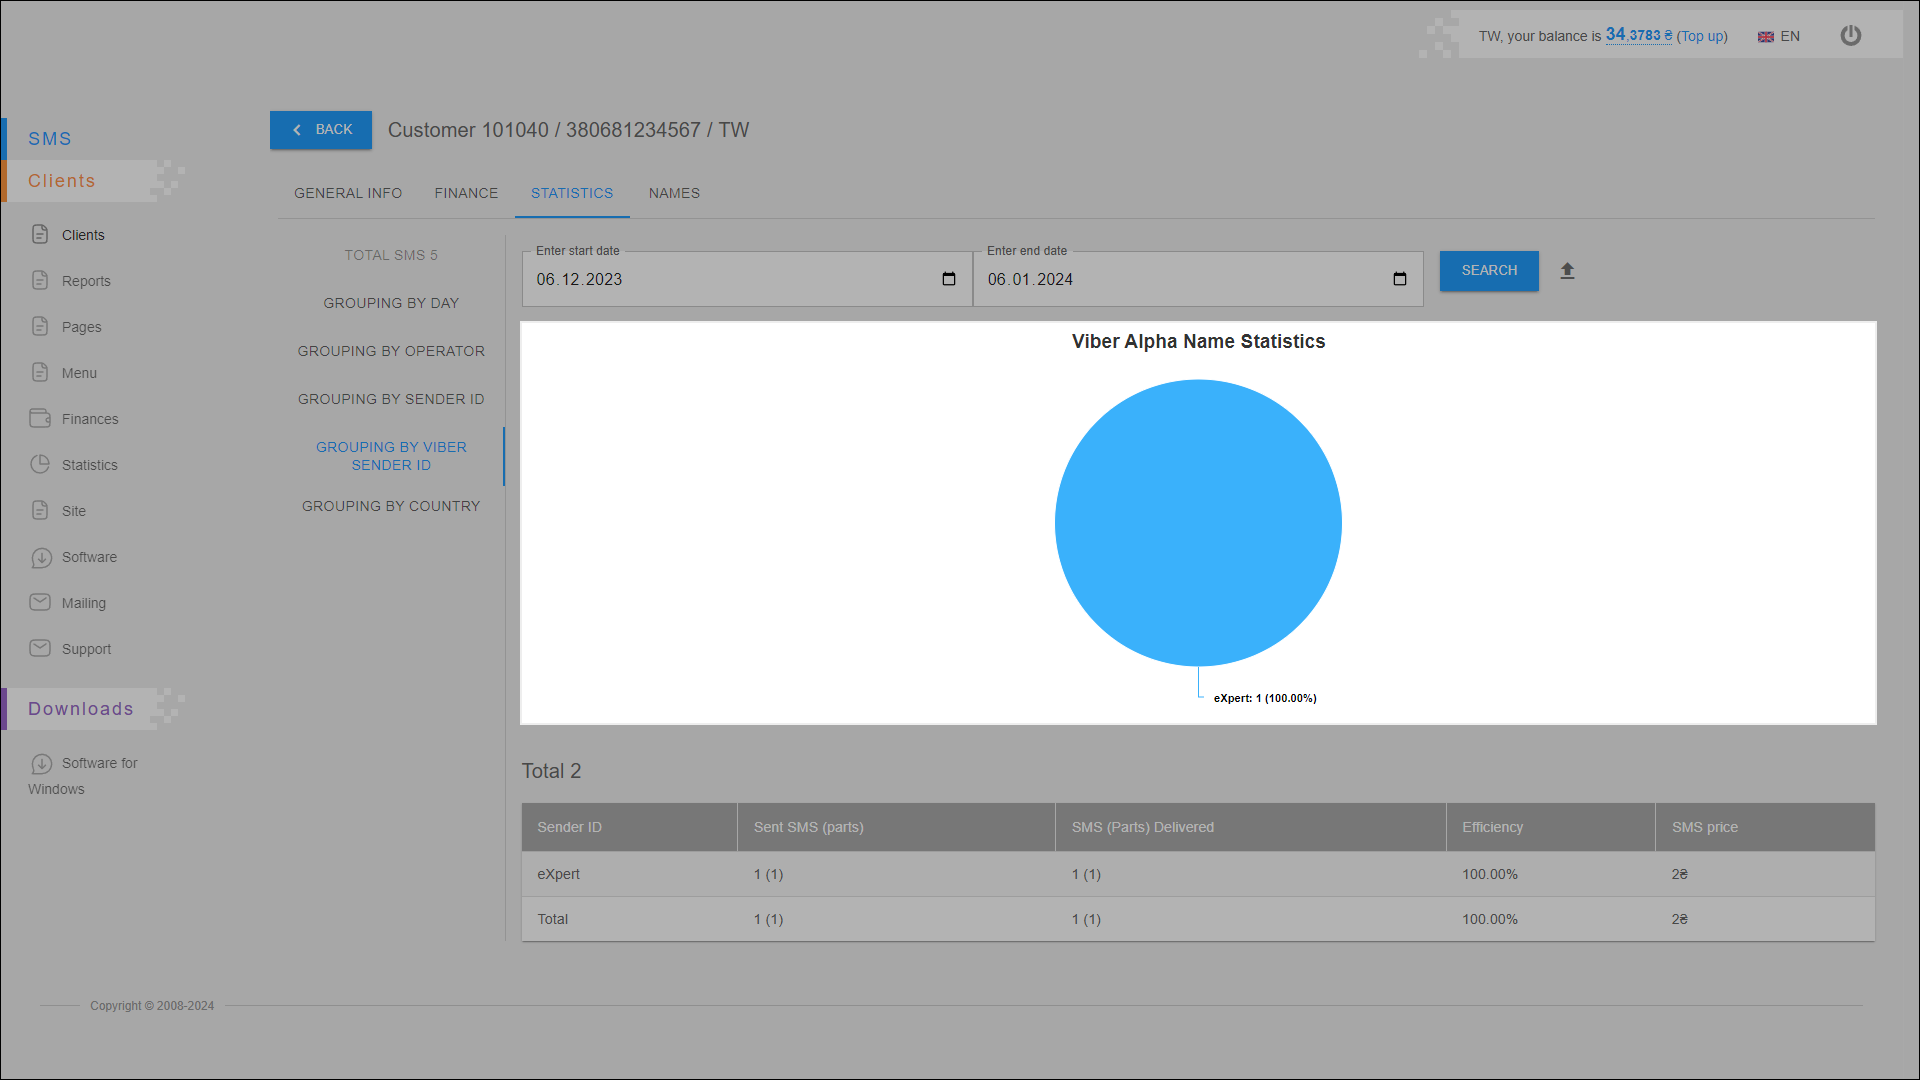
Statistics chart
This chart displays the number of sent viber messages for each sender ID. Statistics are displayed for the specified period.
Statistics table
All statistical data are arranged in the table in separate columns:
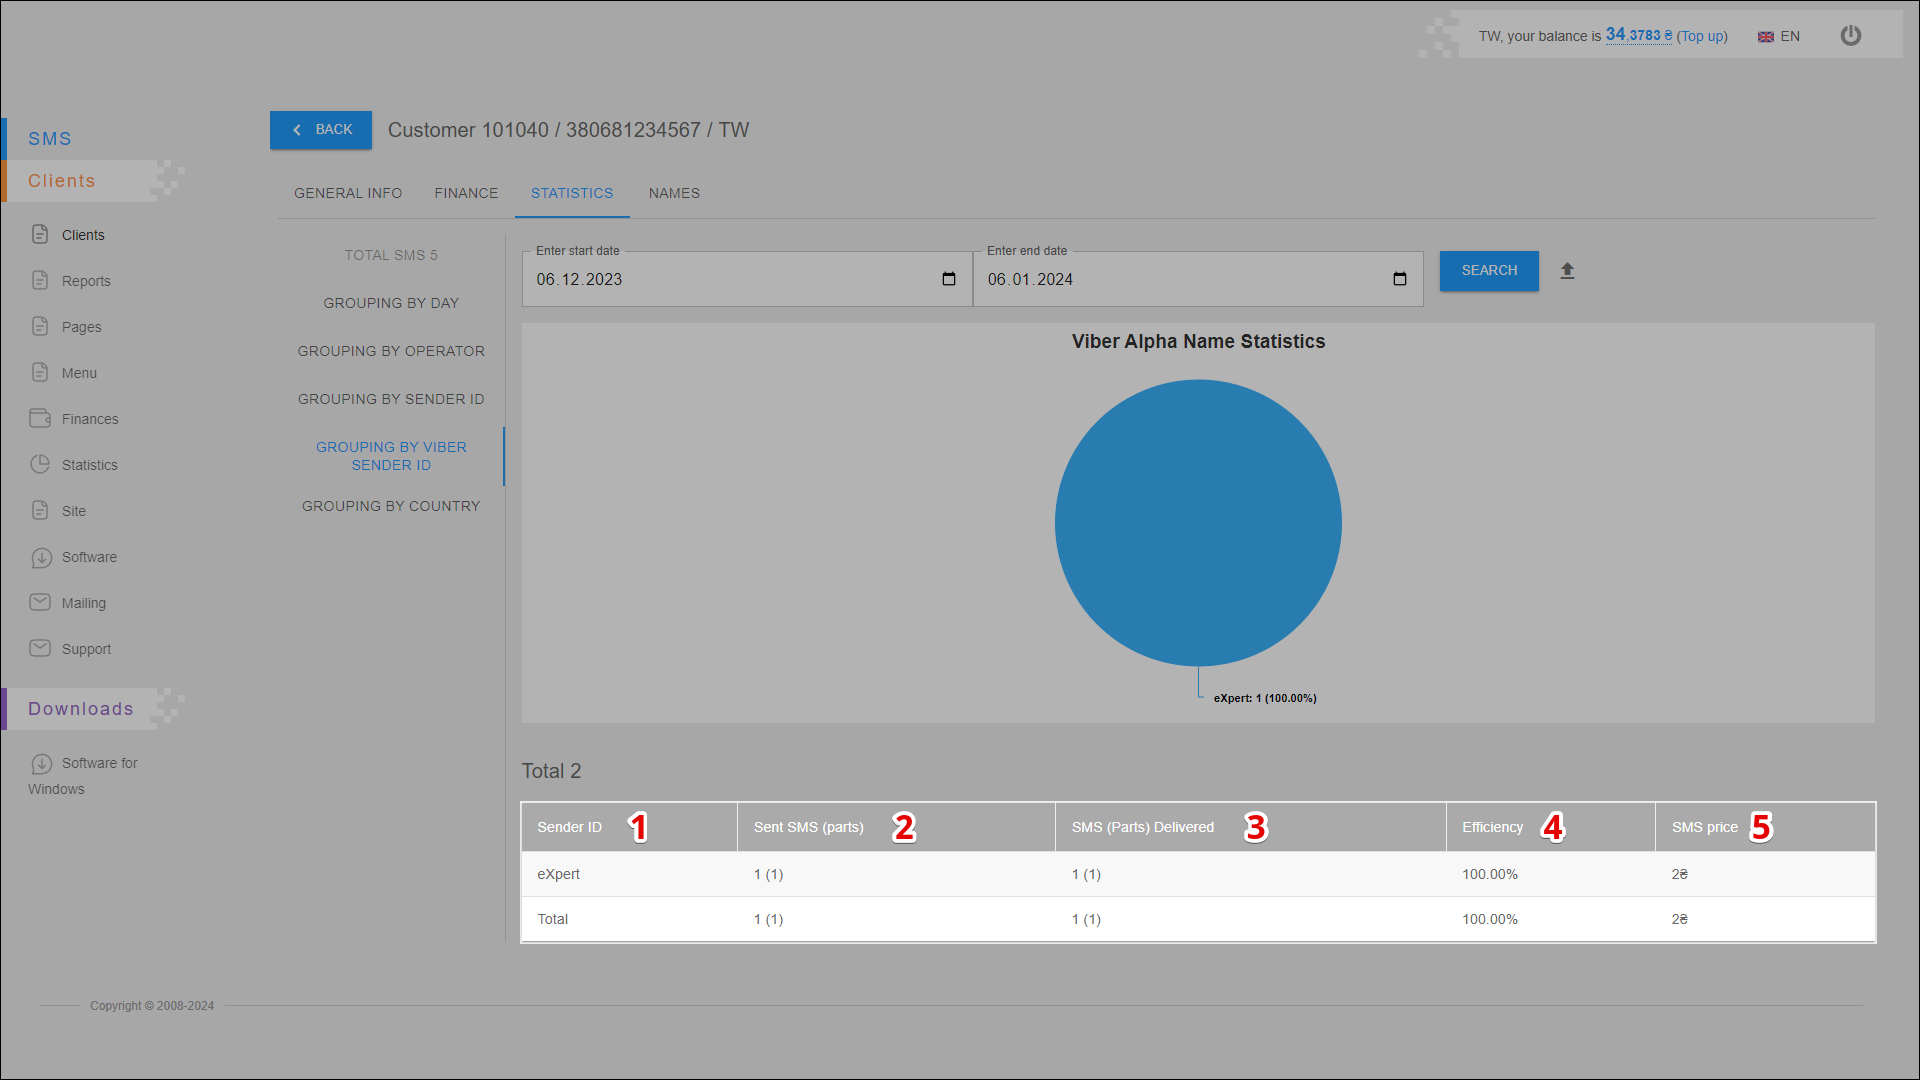
| № | Column | Description |
|---|---|---|
| 1 | Sender ID | Sender's name (ID) |
| 2 | Send SMS (parts) | Number of sent messages (parts) |
| 3 | SMS (Parts) Delivered | Number of delivered messages (parts) |
| 4 | Efficiency | Mailing efficiency (number of delivered messages out of the total number of sent messages ) |
| 5 | SMS Price | Messaging costs |
GROUPING BY COUNTRY
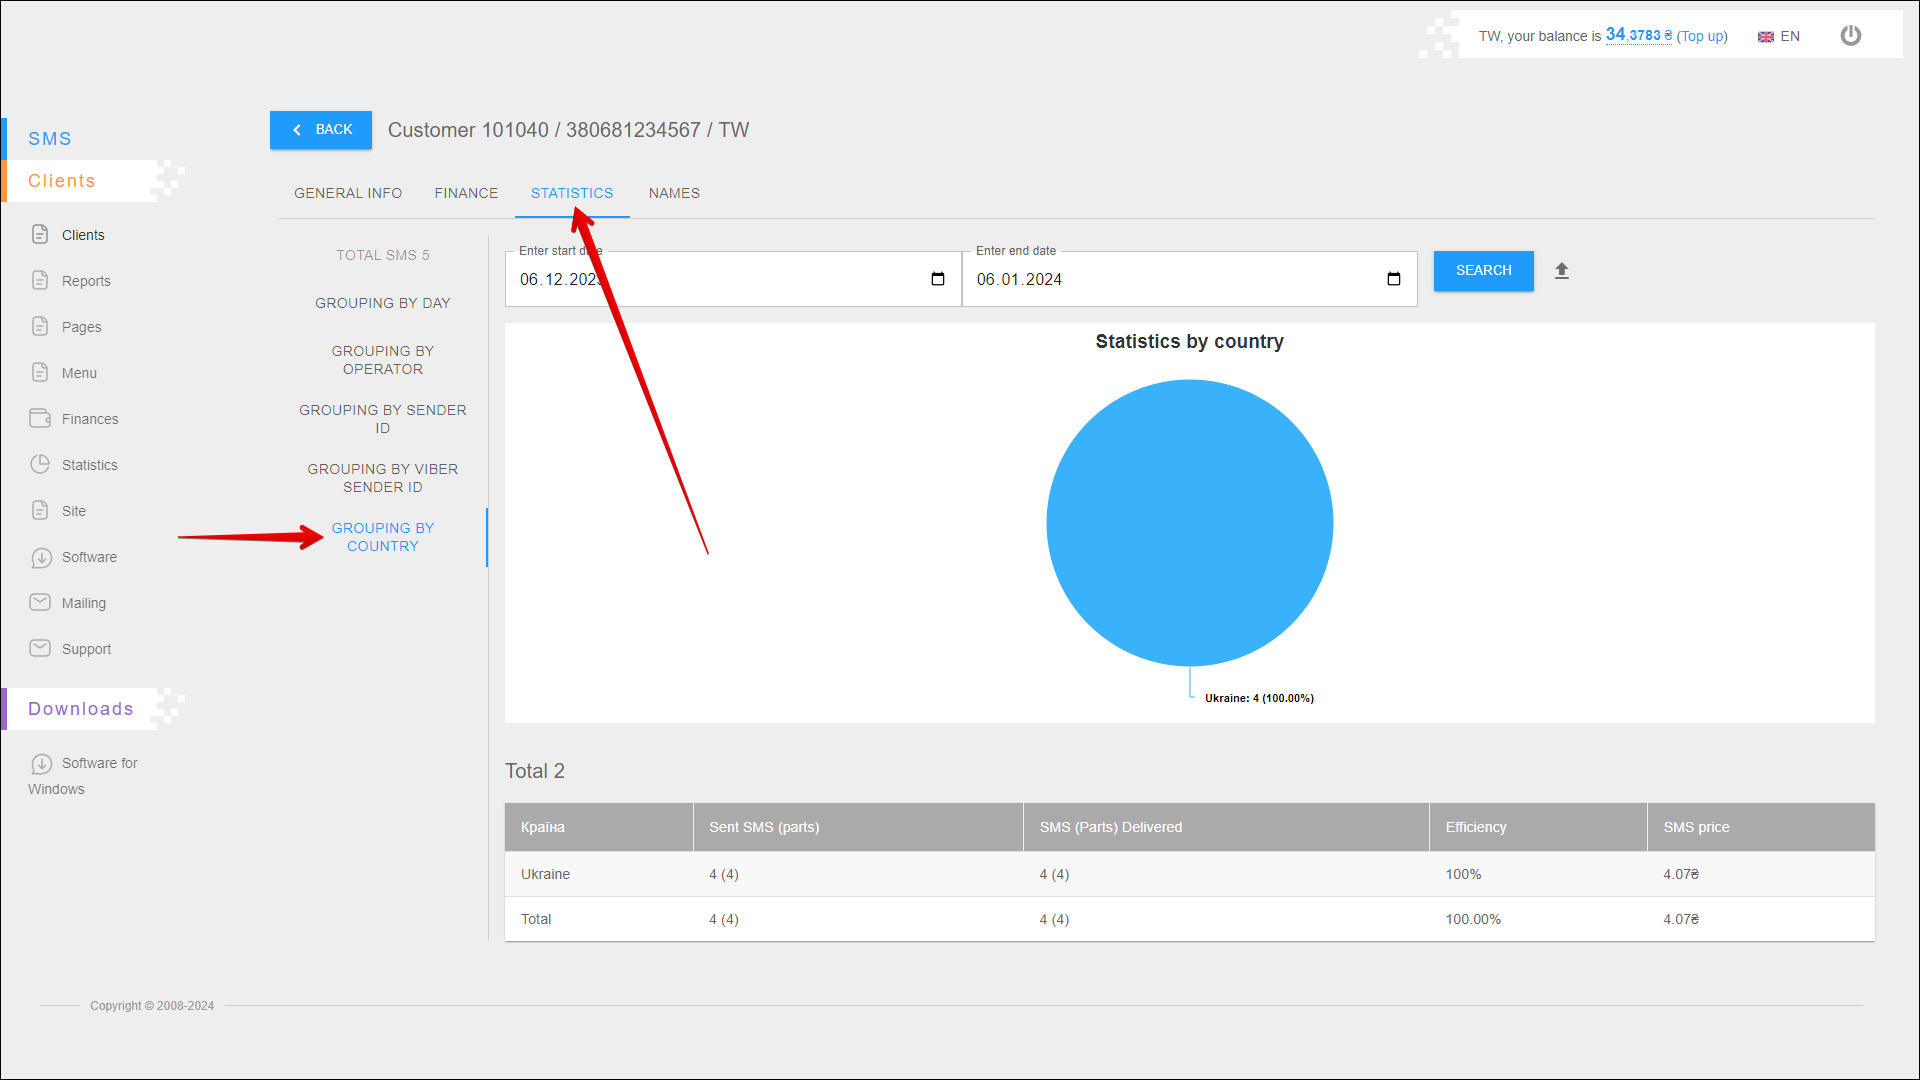
In this report you can view statistics by country and also check the efficiency of the mailing.
To open this report, open the STATISTICS tab and select the GROUPING BY COUNTRY report.
Period selection
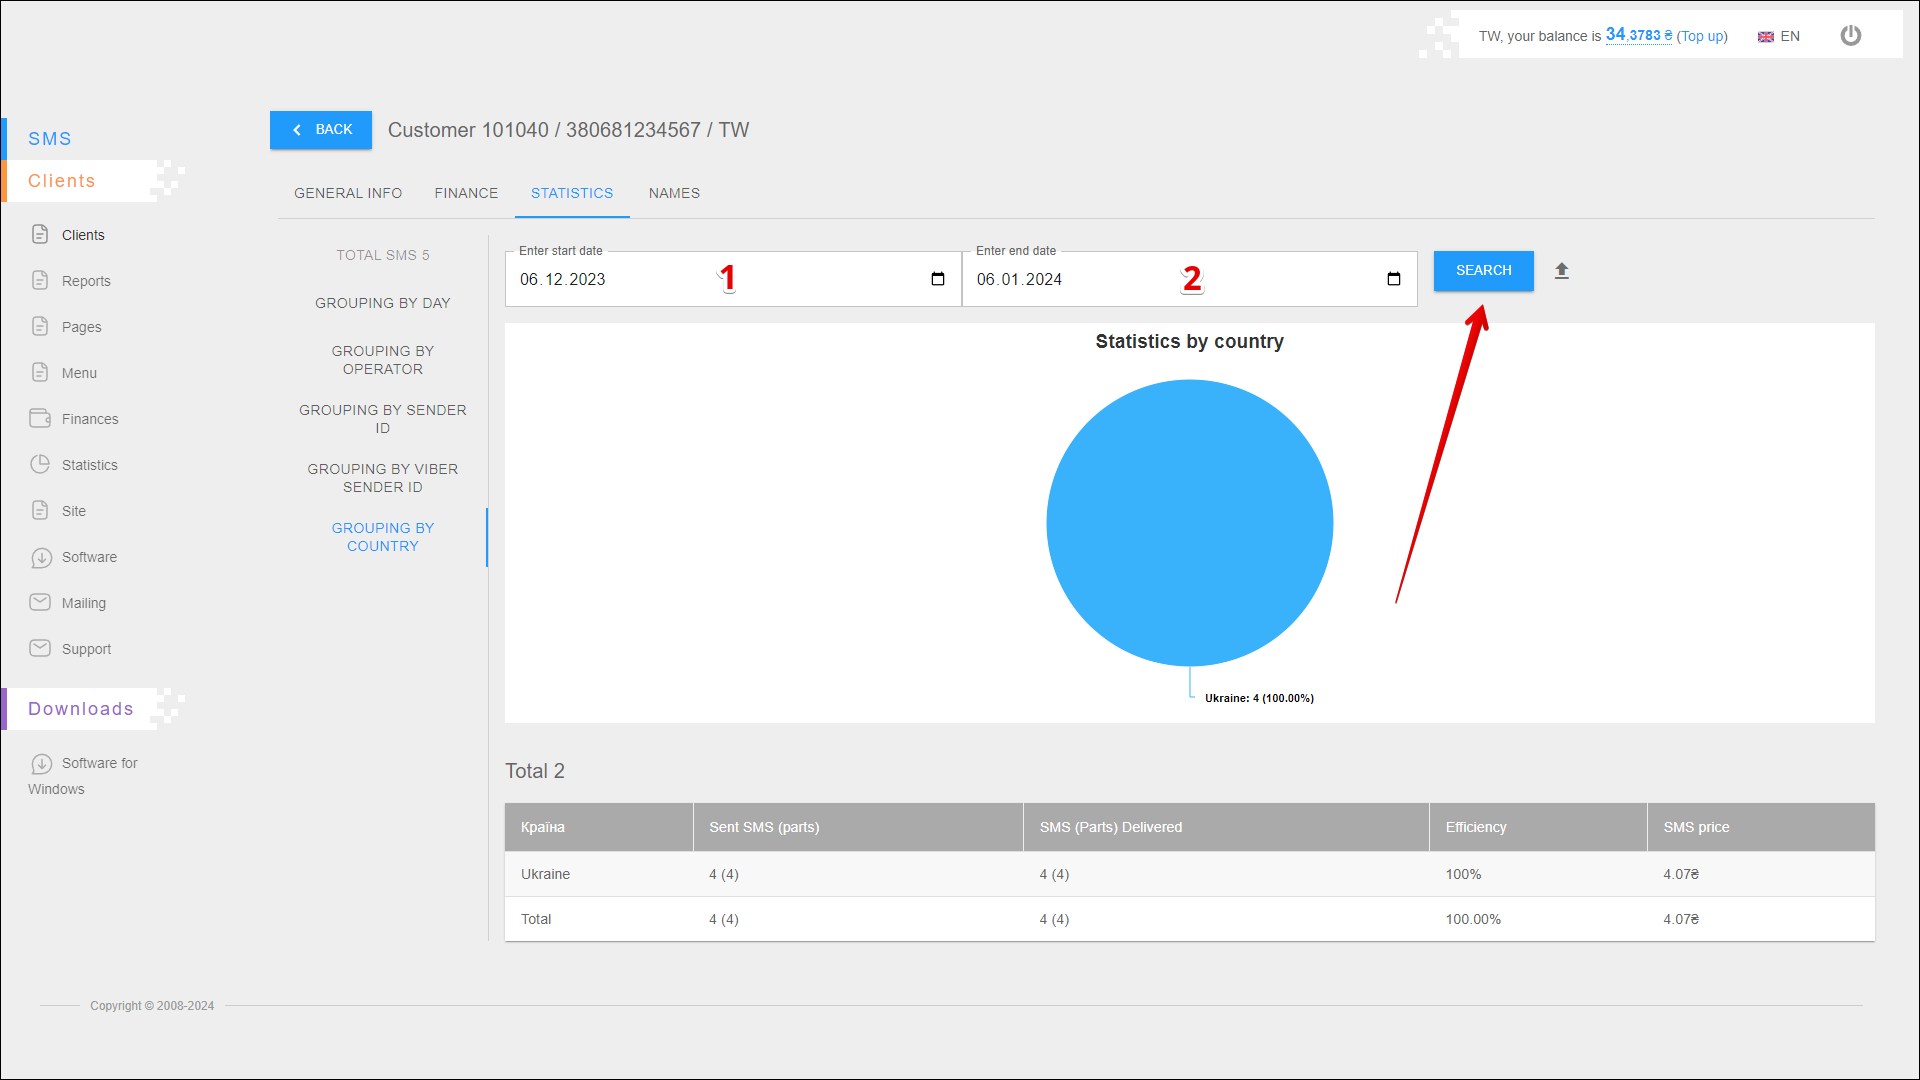
To select the time period for which you want to display statistic, follow the steps below:
| № | Action |
|---|---|
| 1 | Enter the start date. You can enter the date manually or select it in the calendar, to do this, click the Calendar icon on the right side of the field |
| 2 | Enter the end date. You can enter the date manually or select it in the calendar, to do this, click the Calendar icon on the right side of the field |
After selecting a date, click the SEARCH button. The page will be refreshed and display statistics for the specified period.
Exporting a report
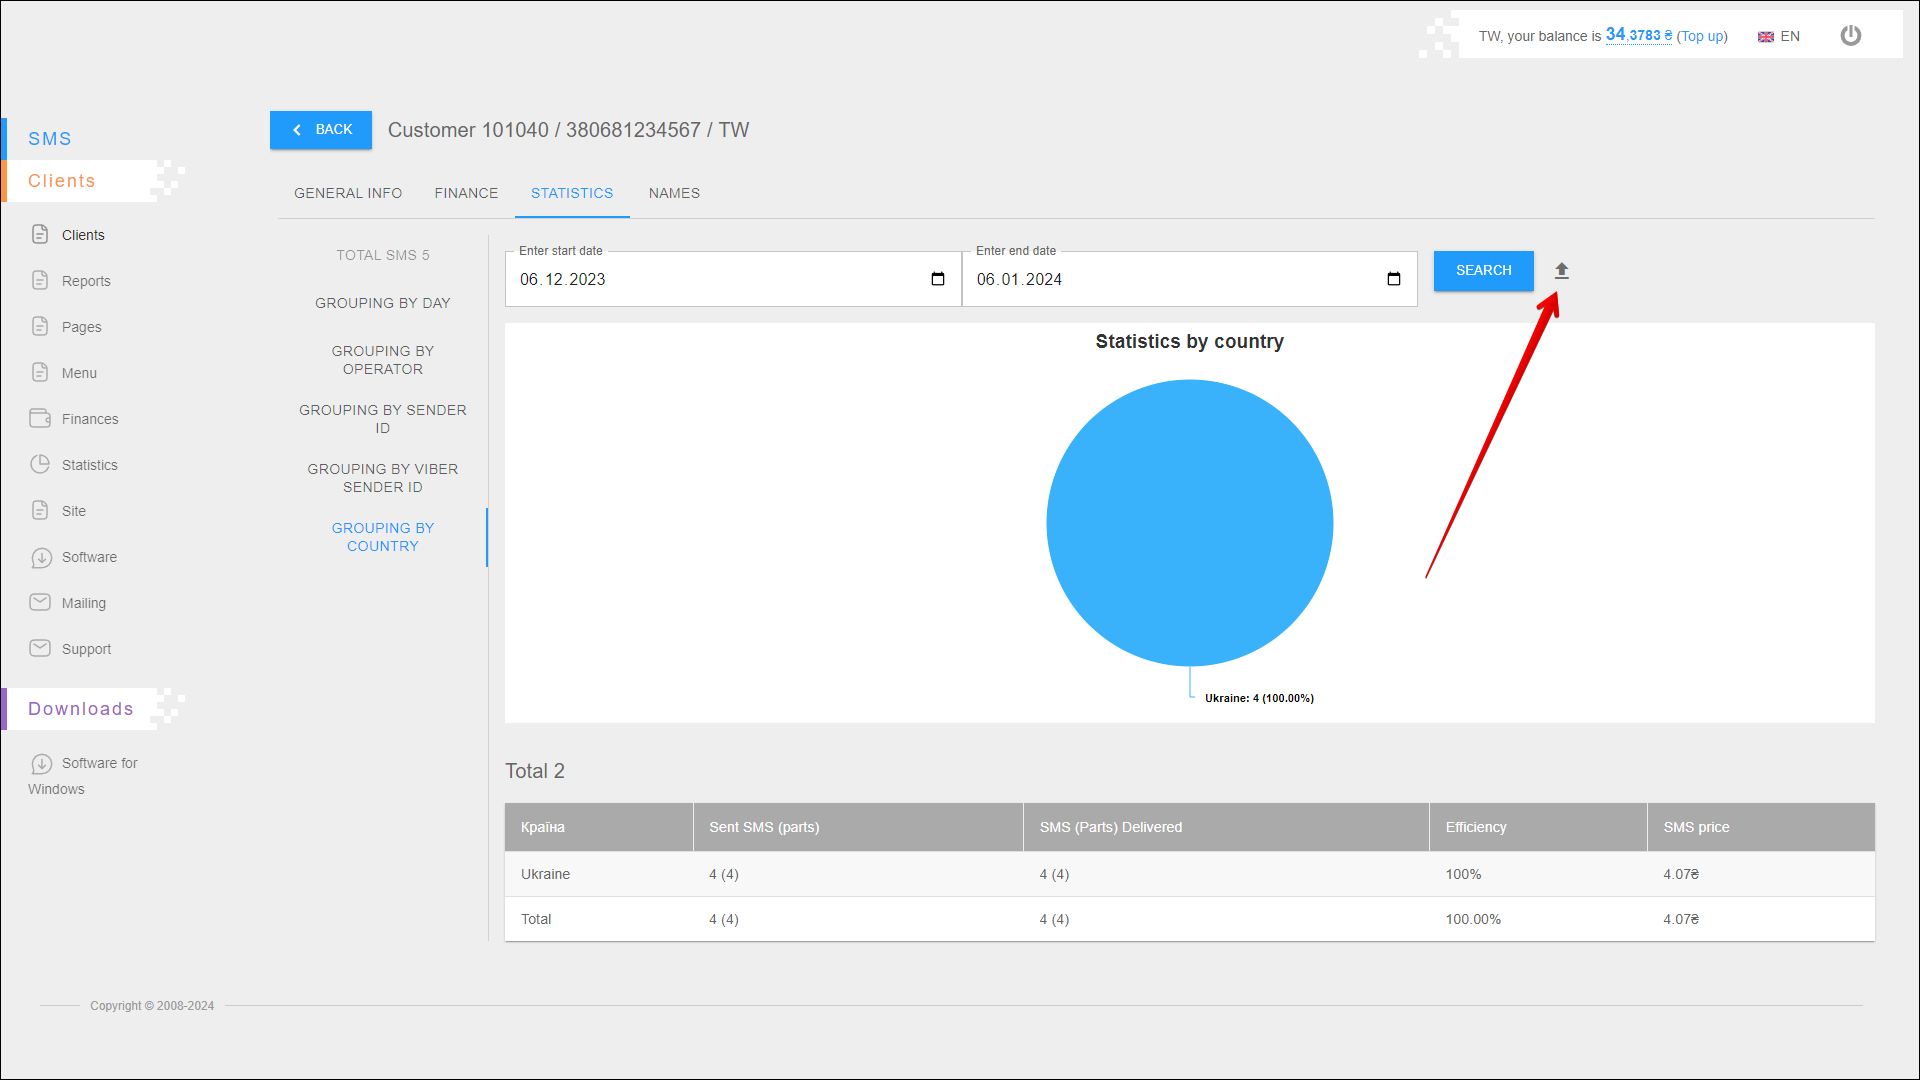
To export statistical reporting click the Export button icon to the right of the SEARCH button.
A new pop-up window will open where you need to select the data you want to export. After selecting the data, click the EXPORT button to export. To cancel, click the CANCEL button.
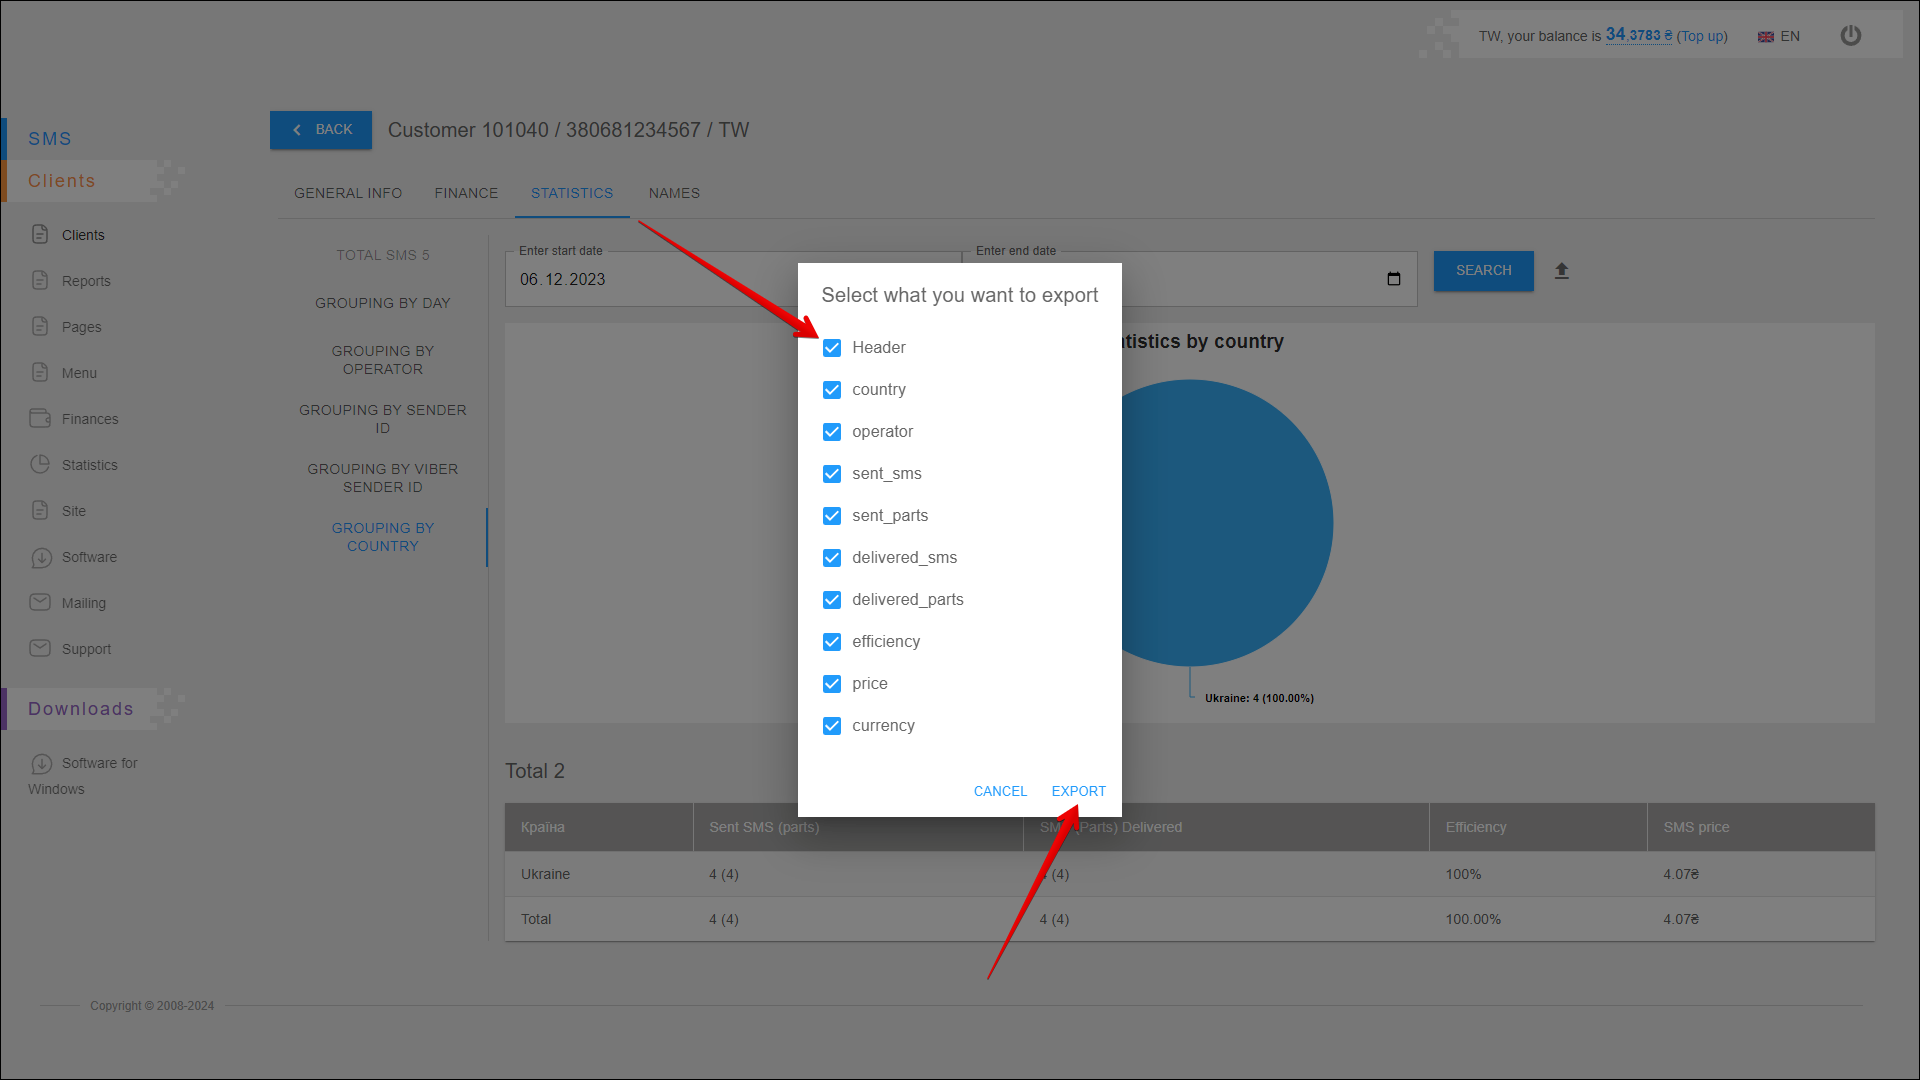
After pressing the EXPORT button, the report will be saved on your device in an .xlsx file.
Statistics chart
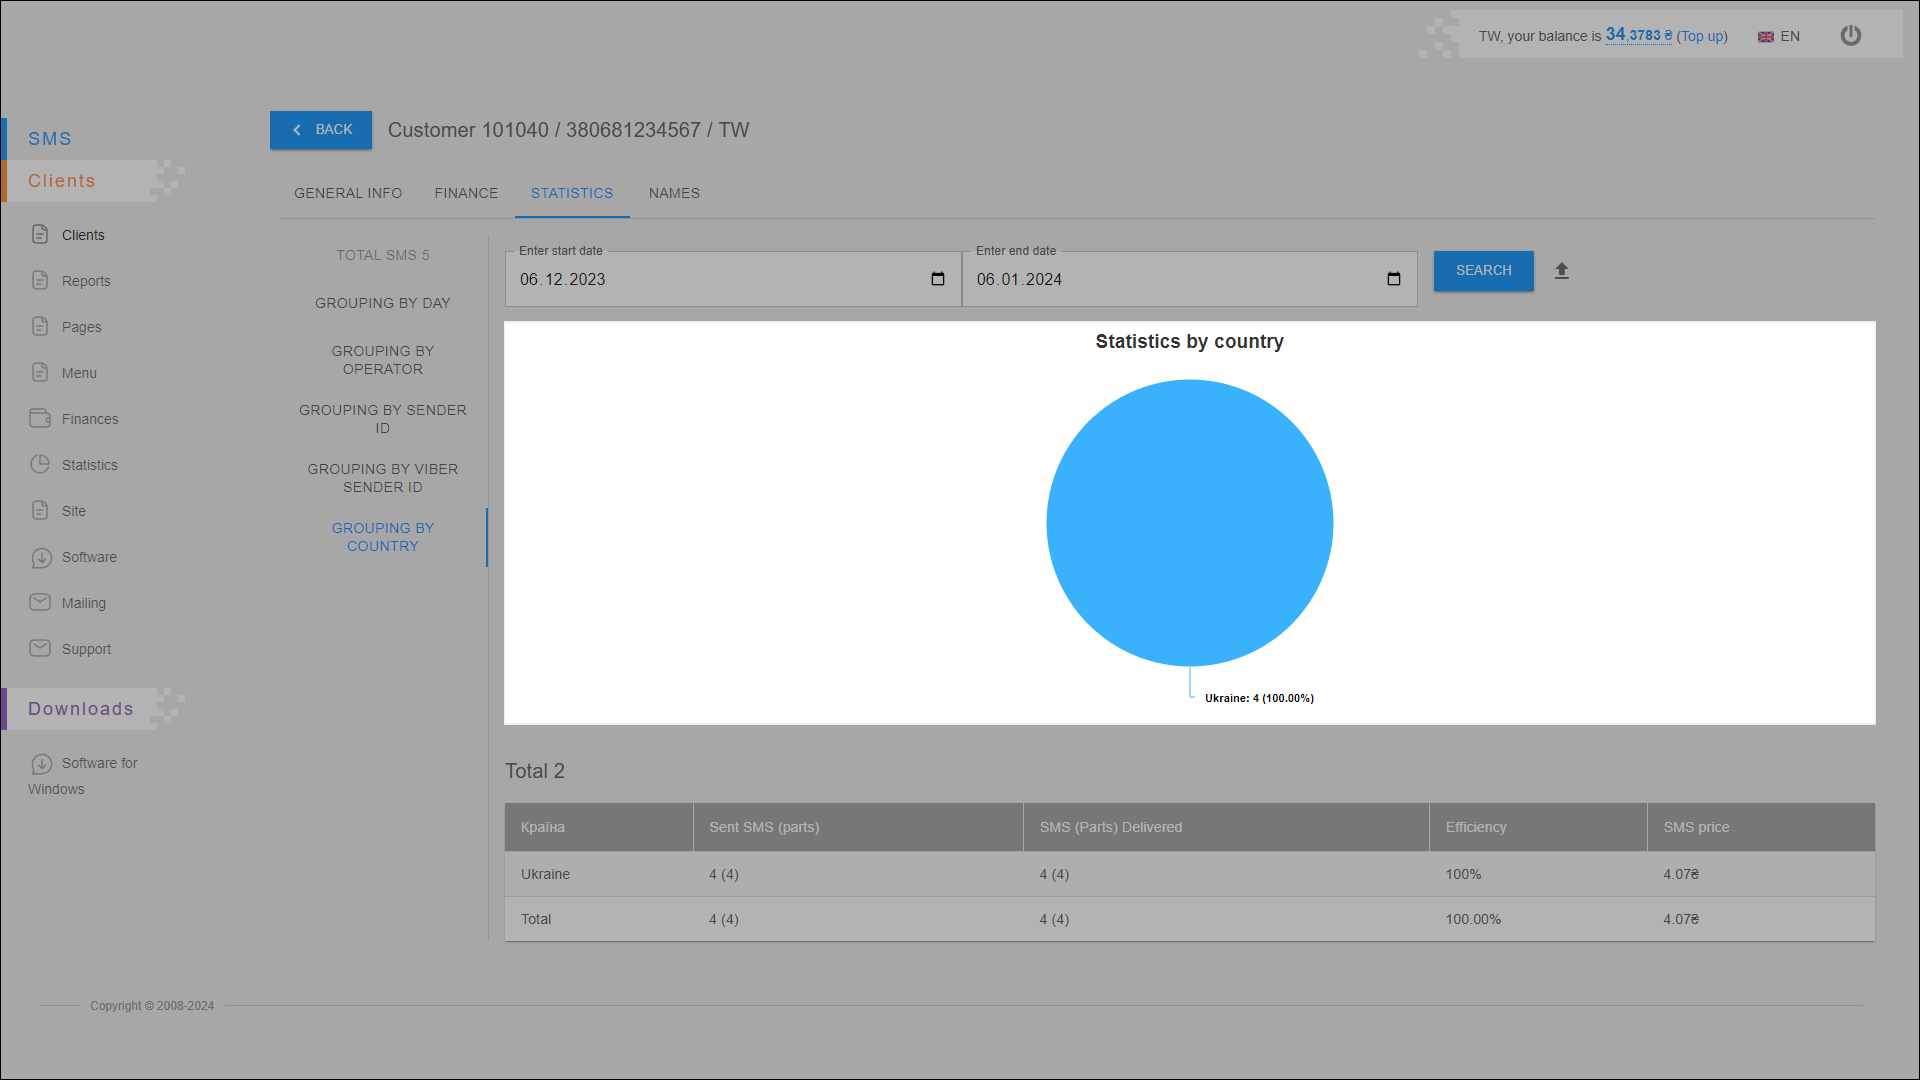
This chart displays the number of sent messages for each country. Statistics are displayed for the specified period.
Statistics table
All statistical data are arranged in the table in separate columns:
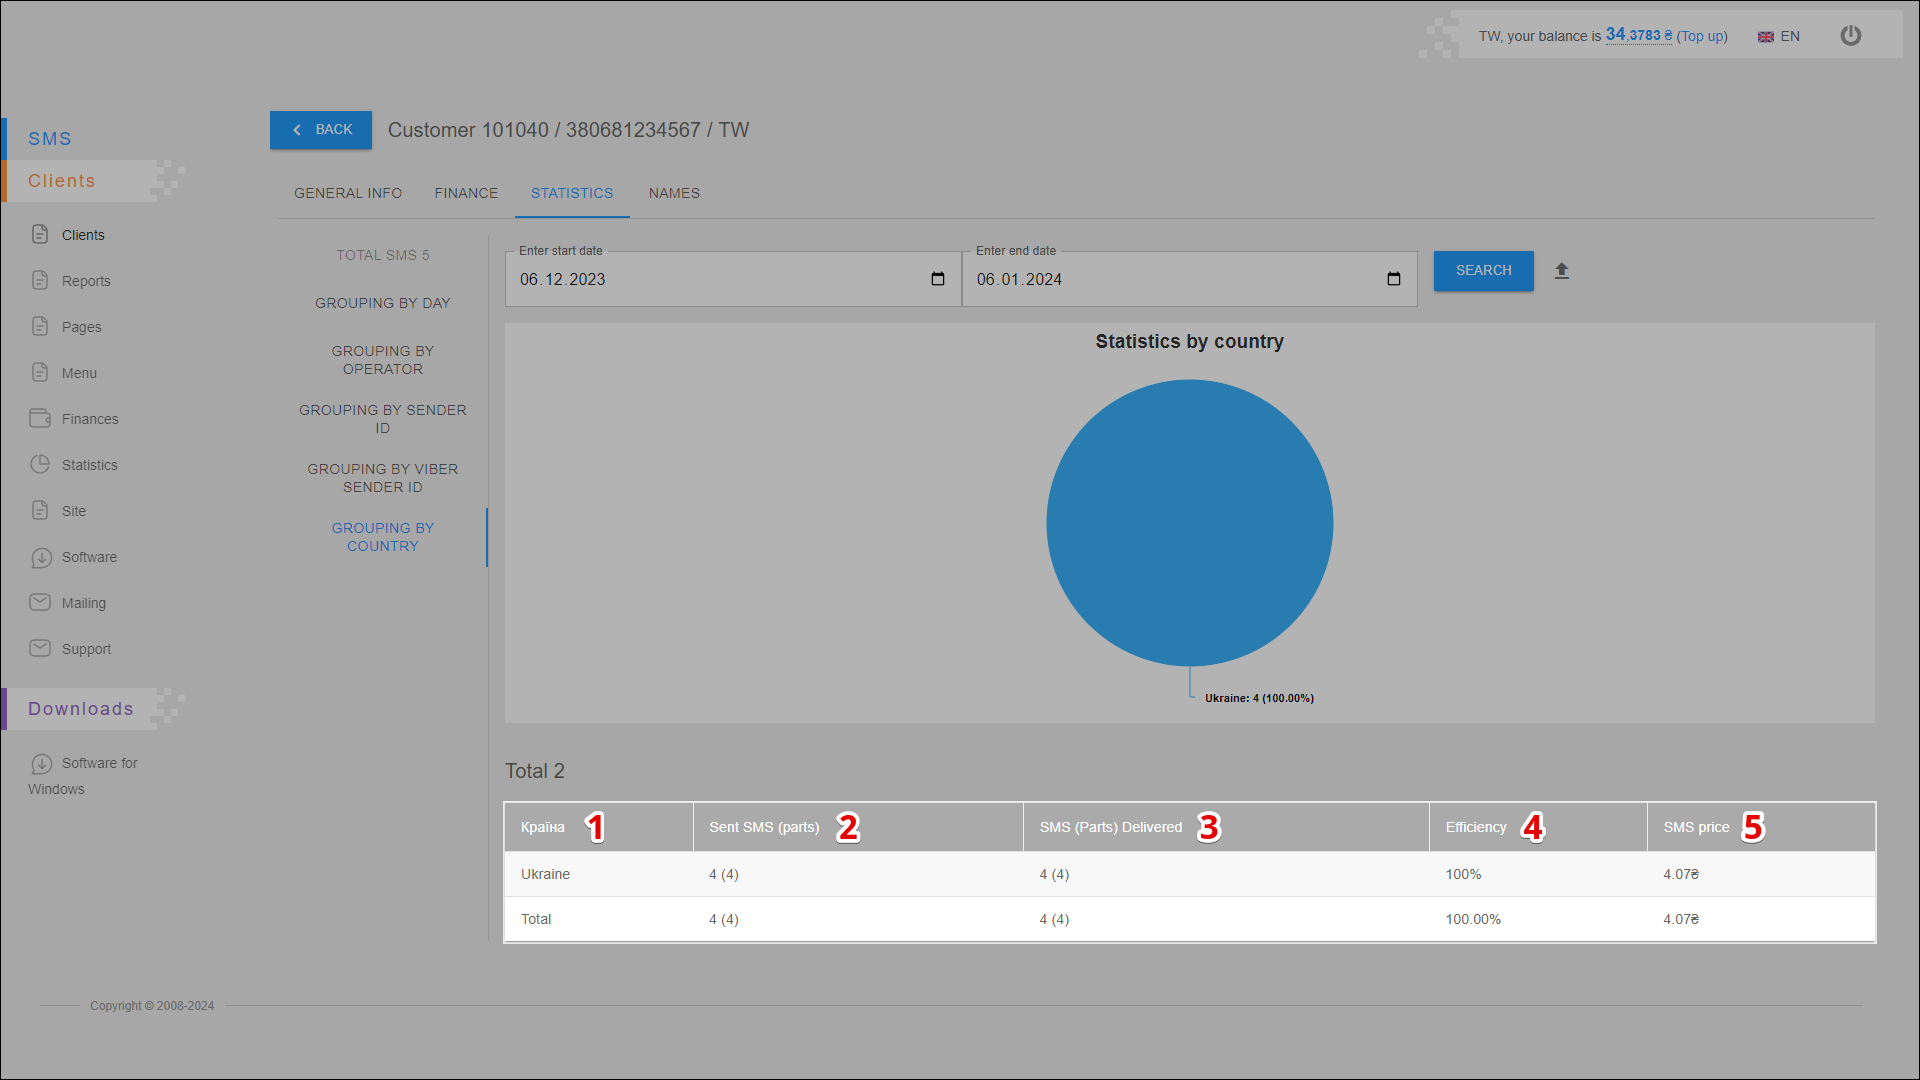
| № | Column | Description |
|---|---|---|
| 1 | Country | Country name |
| 2 | Send SMS (parts) | Number of sent messages (parts) |
| 3 | SMS (Parts) Delivered | Number of delivered messages (parts) |
| 4 | Efficiency | Mailing efficiency (number of delivered messages out of the total number of sent messages ) |
| 5 | SMS Price | Messaging costs |
NAMES
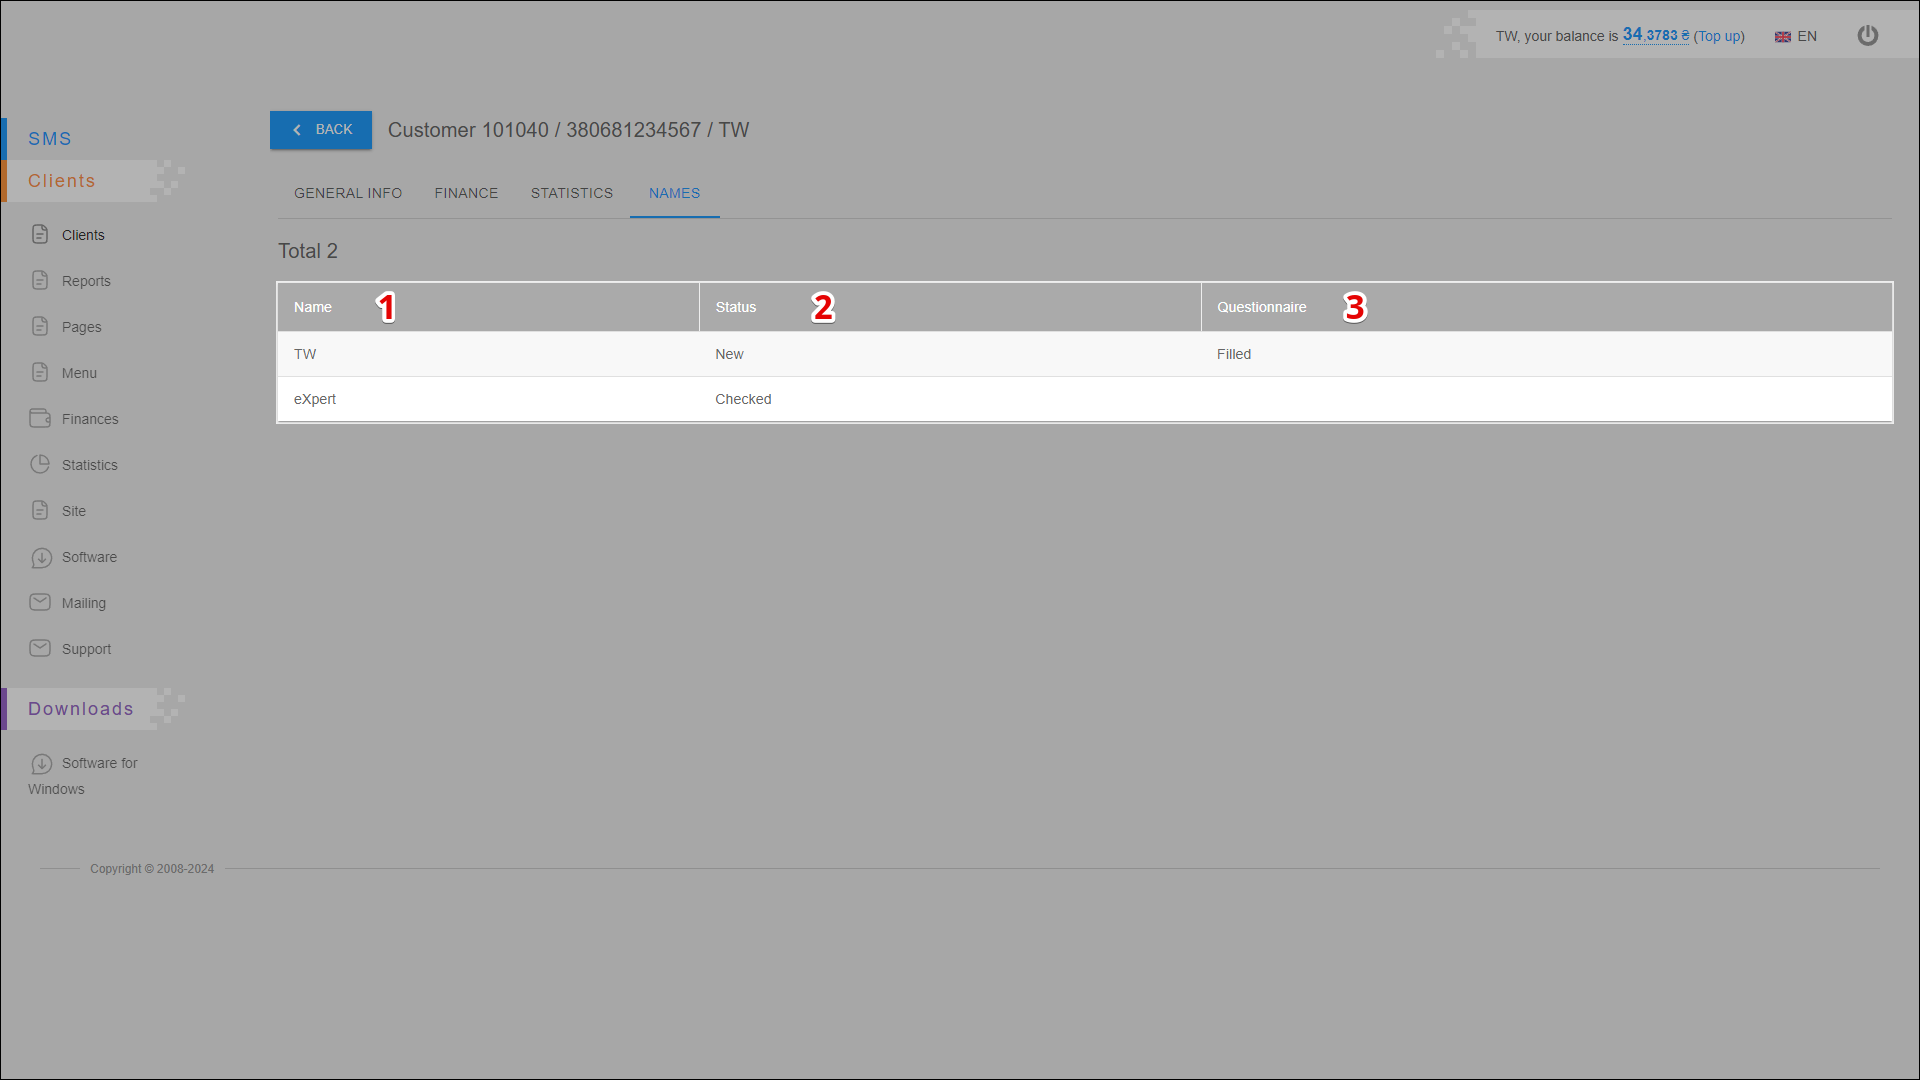
The NAMES tab contains a list of client sender id's with detailed information about them. These names are used for sending messages.
All client sender id's are located in a table with separate columns:
| № | Column | Description |
|---|---|---|
| 1 | Name | Sender's name (Sender ID) |
| 2 | Status | Current status of the sender ID |
| 3 | Questionnaire | Completion of the questionnaire |